node-red-dashboard-2-state-inspector-energiam 0.1.7
Native Dashboard 2.0 widget for Node-RED — capture variable snapshots at different machine states and compare them side-by-side in a live table. Data-source agnostic, designed for IIoT state machine debugging.

State Inspector
node-red-dashboard-2-state-inspector-energiam
Native Dashboard 2.0 widget for Node-RED — freeze variable snapshots at different machine states and compare them side-by-side in a live dark-theme table. Built for IIoT state machine debugging.

What it does
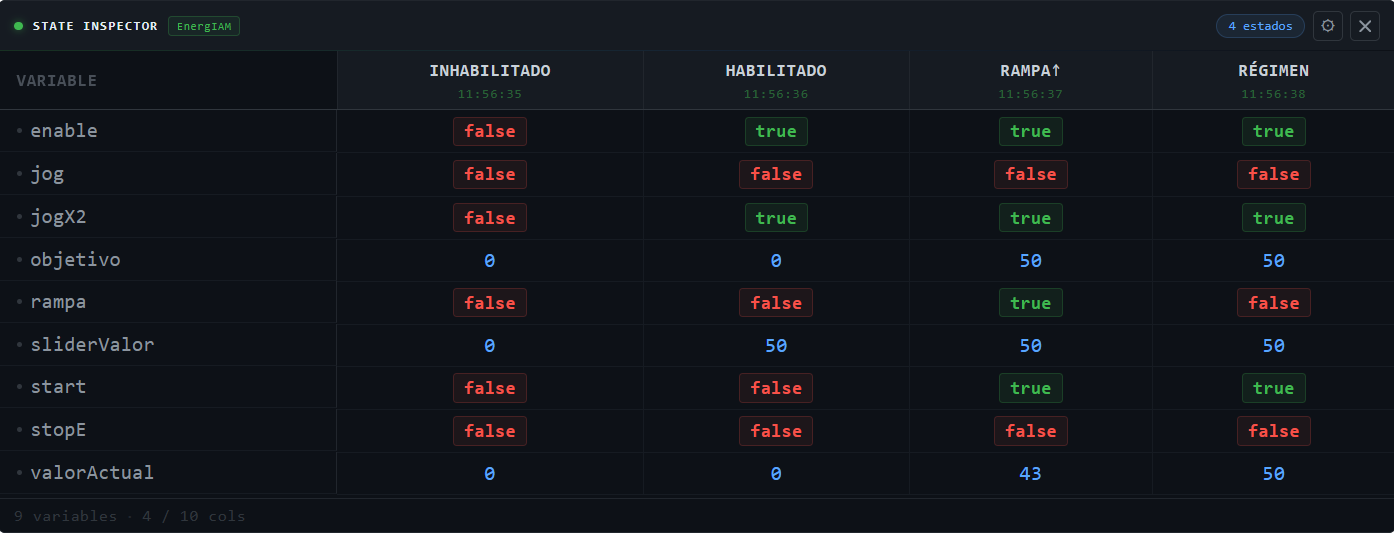
Each message adds or updates a column in the table. Each key in valores becomes a row. Send one message per machine state and get an instant side-by-side comparison.
Inhabilitado   Habilitado   Rampa↑   Régimen
─────────────────────────────────────────────
enable   false      true      true     true
start    false     false      true     true
rampa    false     false      true    false
valorAct     0         0        43       50
Values are color-coded by type — no configuration required:
| Type | Color | Style |
|---|---|---|
true |
#3fb950 green |
bordered badge |
false |
#f85149 red |
bordered badge |
number |
#58a6ff blue |
plain |
string |
#e3b341 yellow |
plain |
null / undefined |
#484f58 grey |
dimmed |
New variable keys are auto-discovered and added as rows on arrival. Columns accumulate up to the configured maximum, dropping the oldest (FIFO).
Requirements
| Dependency | Version |
|---|---|
| Node-RED | ≥ 3.0 |
| @flowfuse/node-red-dashboard | ≥ 1.0 |
| Node.js | ≥ 18 |
Installation
Via Palette Manager — search for node-red-dashboard-2-state-inspector-energiam in
Menu → Manage Palette → Install.
Via npm:
cd ~/.node-red
npm install node-red-dashboard-2-state-inspector-energiam
# then restart Node-RED
Quick start
1. Place the node
Drag state inspector (category: EnergIAM) onto the canvas and assign it a Dashboard 2.0 group.
2. Send a snapshot
// Function node example
msg.payload = {
    nombre: "Habilitado",          // column header
    valores: {
        enable:      true,
        start:       false,
        objetivo:    50,
        valorActual: flow.get("valorActual")
    }
}
return msg
Each call to the node with a different nombre adds a new column.
Calling it again with the same nombre updates that column in-place.
3. Reset or remove columns
// Clear the whole table
msg.topic = "state-inspector/reset"

// Remove one column by name
msg.topic   = "state-inspector/remove"
msg.payload = { nombre: "Habilitado" }

// Same via payload.action
msg.payload = { action: "reset" }
msg.payload = { action: "remove", nombre: "Habilitado" }
Node configuration
| Property | Default | Description |
|---|---|---|
| Group | — | Dashboard 2.0 group (required) |
| Width / Height | auto | Widget size in grid units |
| Max columns | 10 |
Oldest column is dropped when the limit is exceeded (FIFO) |
| Row order | arrival |
arrival — insertion order · alpha — alphabetical |
| Color true | #3fb950 |
Badge background for true values |
| Color false | #f85149 |
Badge background for false values |
| Color number | #58a6ff |
Text color for numeric values |
| Color string | #e3b341 |
Text color for string values |
| Color null | #484f58 |
Text color for null / undefined |
Runtime settings — ⚙ gear panel
Click the ⚙ button in the widget toolbar to open the settings panel. Changes apply instantly and persist in localStorage.
| Setting | Options | Default |
|---|---|---|
| Font size | XS (10px) · S (12px) · M (14px) · L (16px) | S |
| Row density | Compact · Normal · Relaxed | Normal |
| Timestamps | on / off | off |
| Sticky variable column | on / off | on |
Input message reference
Add / update a column
─────────────────────────────────────────────
msg.payload = {
    nombre:  string    // column label (required)
    valores: object    // flat key → value map (required)
}

Control messages
─────────────────────────────────────────────
msg.topic = "state-inspector/reset"           // clear all columns
msg.topic = "state-inspector/remove"          // remove column
msg.payload = { nombre: "ColumnName" }        //   ↑ column to remove

// Equivalent via payload.action:
msg.payload = { action: "reset" }
msg.payload = { action: "remove", nombre: "ColumnName" }
Node status indicators
| Indicator | Meaning |
|---|---|
🟢 N estado(s) |
N columns currently in the table |
⚫ sin datos |
Table is empty — waiting for input |
🔴 sin grupo |
No Dashboard 2.0 group assigned |
Example flow
Import examples/flows_state_inspector_test.json via Menu → Import.
The example simulates a variable-speed drive cycling through four states:
Inhabilitado → Habilitado → Rampa↑ → Régimen — one inject button per state plus a RESET button.
Architecture
This is a first-class native Dashboard 2.0 widget, not a ui-template workaround.
| Layer | Implementation |
|---|---|
| Backend | Registers via group.register(node, config, evts) — same API as built-in widgets |
| Transport | msg-input:<nodeId> socket channel (standard Dashboard 2.0 protocol) |
| Frontend | Vue 3 SFC compiled to UMD, loaded by Dashboard from /resources/ |
| Socket | inject: ['$socket'] — Dashboard 2.0 provides the socket via Vue DI |
| State | Per-instance Node-RED context (node.context()) |
| Styling | CSS injected into UMD bundle — no external stylesheet dependency |
Contributing
Issues and PRs are welcome at
github.com/energiamEcoTouch/node-red-dashboard-2-state-inspector-energiam
License
MIT © 2026 EnergIAM EcoTouch
Made with ☕ and monospace fonts by Adrian Iskow