node-red-contrib-ui-statechart 0.2.1
A Node-RED dashboard ui node.
node-red-contrib-ui-statechart
Description
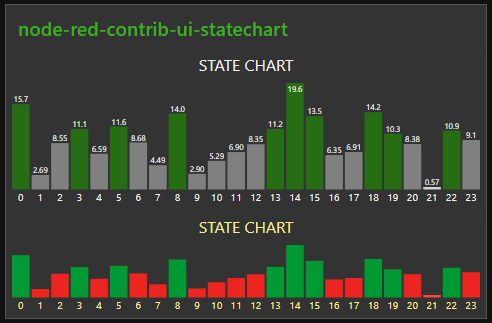
Node-RED dashboard widget. Bar chart to visualize numeric values in relation, together with state represented by color.

State chart is special chart to combine visualization of value relations with state. The state is fully under user control. Chart doesn't calculate state for the series.
Configuration
Series
Configuring the series is mandatory. Series presented as name of the bar. Make them short as they do not rotate or scale.
Configuration input of the series must be filled with comma separated string. Avoid space unless it is intentional.
For example: dog,cat,cow,sheep,goat
Series shortcuts
In addition the series can be automatically generated for 24 hours.
By using shortcut 24H the series generated with format 00,01,02,...,22,23
Shortcut 24h generates series without leading zeros - 0,1,2,...,22,23
Using valid shortcut adds option to turn on the highlight of bar represents current hour. To do so, use syntax 24H|L
Limits
By default the graph will be autoscaling so that it will adjust the y-axis to the range of the data. You can change this behavior by explicitly setting the limits. To do this uncheck Use dataset min & max checkbox and specify custom limits. One or both limits can be specified. If only one limit is specified, the other will still auto-scale. The y-axis will then range at least from Min to Max. Auto-scaling will still permit those boundaries to be stretched if the dataset exceeds the specified limits.
Other configurable options
- Hide or show values
- Color of bars
- Font sizes
- Color of texts
Input
Every bar in chart can be updated with new data independently. So you can send new data only for series where changes are needed.
msg.payload should carry an array of Object(s) where
required properties are:
series- (string) name of seriesvalue- (number) valuestate- (boolean) state
Optional property
color- (string) color of bar
color property sets the color for the bar. This overrides the state and the colors defined in config. Accepted definition of color is named HTML color, RGB or hex (e.g red , RGB(100,50,64), #00CC45)
msg.payload = [{series:"A",value:123,state:true, color:"#00CC45"},{series:"D",value:32,state:false}]
msg.title (string) title of chart can be changed by sending new value msg.title = TILE OF CHART
Appendix
This widget is created for dedicated use. This restricts adding external dependencies and the widget must be held lightweight and responsive. Adding new options is highly possible if it makes sense and can be done with full respect of above.


