@theotherwillembotha/node-red-telemetry 0.1.0
Node-RED nodes for structured logging and Prometheus metrics, built on node-red-plugincore.
@theotherwillembotha/node-red-telemetry
Node-RED nodes for structured logging and Prometheus metrics. Built on @theotherwillembotha/node-red-plugincore.
Usage in Node-RED
Installation
Either use the Manage Palette option in the Node-RED editor, or run the following command in your Node-RED user directory (typically ~/.node-red):
npm install @theotherwillembotha/node-red-telemetry
[!IMPORTANT] This plugin requires
@theotherwillembotha/node-red-plugincoreto be installed.
node-red-plugincoreis declared as a dependency and npm will install it automatically alongside this package. However, due to a known Node-RED limitation, packages that arrive as transitive npm dependencies are only discovered by the Node-RED runtime on the next startup.You have two options:
- Install
@theotherwillembotha/node-red-plugincorevia the palette manager ornpm installfirst, then install this plugin - both will be available immediately without a restart.- Install this plugin directly -
node-red-plugincorewill be installed automatically alongside it. Restart Node-RED once and both packages will be fully loaded.
Nodes
Logging
| Node | Description |
|---|---|
| Logger Node | Logs incoming messages to a configured logging backend. Passes the message through unchanged. Attach a Console Logger or REST Logger config node (both provided by node-red-plugincore), or a Loki Logger config node (provided by node-red-loki) to control the destination. |
Metrics
| Node | Description |
|---|---|
| Counter Metric Node | Increments a Prometheus counter each time a message is received. Displays the current count on the node status. |
| Gauge Metric Node | Increases or decreases a Prometheus gauge on each message. Direction (Increase / Decrease) is configurable per node. |
| Timer Metric Node | Records timing observations to a Prometheus histogram. Supports Start / Stop / Observe modes for measuring durations across multiple nodes in a flow. |
Config nodes (provided by node-red-plugincore)
These config nodes are shared across all plugins built on the framework.
| Config node | Provided by | Purpose |
|---|---|---|
| Console Logger | node-red-plugincore |
Writes log output to stdout |
| REST Logger | node-red-plugincore |
Ships log entries to an HTTP endpoint |
| Loki Logger | node-red-loki |
Ships log entries to Grafana Loki - install separately |
| Counter Metric | node-red-plugincore |
Prometheus counter definition |
| Gauge Metric | node-red-plugincore |
Prometheus gauge definition |
| Timer Metric | node-red-plugincore |
Prometheus histogram / summary definition |
Examples
Metrics Example
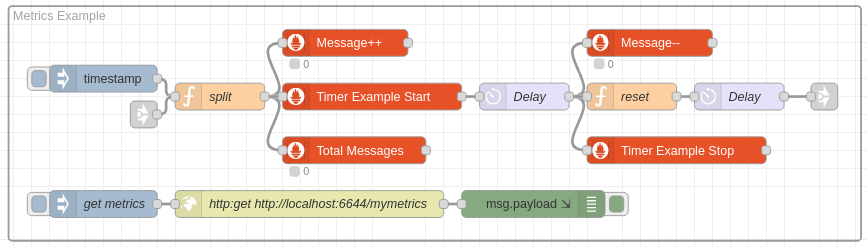
A timestamp trigger feeds a message into three nodes simultaneously:
- Metrics ++ - a gauge that increments on every message.
- Total Messages - a counter that increments on every message.
- Timer Example Start - a timer node that starts a timer and injects a reference into the message payload so it can be correlated later.
The message is then delayed by a few seconds before being handed off to two further nodes:
- Metrics -- - the same gauge used by Metrics ++, this time decrementing it.
- Timer Example Stop - stops the timer that was started by Timer Example Start and records the observation.
The Get Metrics injection polls the metrics endpoint directly, retrieving the current state of all registered metrics - the same way Prometheus would scrape them.
Example scrape output:
# HELP counter_50f031bdf8f60f85 an example couter
# TYPE counter_50f031bdf8f60f85 counter
counter_50f031bdf8f60f85{flow="undefined",type="CounterMetricConfigNode",name="My Counter",id="50f031bdf8f60f85",metric="My Counter"} 6

# HELP summary_6a528fb7faa12ba3 an example timer
# TYPE summary_6a528fb7faa12ba3 summary
summary_6a528fb7faa12ba3{quantile="0.01",flow="undefined",type="TimerMetricConfigNode",name="Timer Example",id="6a528fb7faa12ba3",metric="Timer Example"} 1013.7
summary_6a528fb7faa12ba3{quantile="0.1",flow="undefined",type="TimerMetricConfigNode",name="Timer Example",id="6a528fb7faa12ba3",metric="Timer Example"} 1097
summary_6a528fb7faa12ba3{quantile="0.9",flow="undefined",type="TimerMetricConfigNode",name="Timer Example",id="6a528fb7faa12ba3",metric="Timer Example"} 2847
summary_6a528fb7faa12ba3{quantile="0.99",flow="undefined",type="TimerMetricConfigNode",name="Timer Example",id="6a528fb7faa12ba3",metric="Timer Example"} 2991.45
summary_6a528fb7faa12ba3_sum{flow="undefined",type="TimerMetricConfigNode",name="Timer Example",id="6a528fb7faa12ba3",metric="Timer Example"} 184628
summary_6a528fb7faa12ba3_count{flow="undefined",type="TimerMetricConfigNode",name="Timer Example",id="6a528fb7faa12ba3",metric="Timer Example"} 95

# HELP gauge_a90b1d118eeefaee an example gauge
# TYPE gauge_a90b1d118eeefaee gauge
gauge_a90b1d118eeefaee{flow="undefined",type="GaugeMetricConfigNode",name="Messages being processed",id="a90b1d118eeefaee",metric="Messages being processed"} 1
Repository
- Source: github.com/theotherwillembotha/nodered_telemetry
- Issues: github.com/theotherwillembotha/nodered_telemetry/issues