node-red-contrib-ui-timelines-chart 0.1.9
A Node-RED widget node for showing the timelines chart.
node-red-contrib-ui-timelines-chart
A Node-RED widget node for showing the timelines chart.
Pre-requisites
The node-red-contrib-ui-timelines-chart requires Node-RED Dashboard 2.10 to be installed.
Quick Start
To pull from docker hub:
docker pull sanlike0911/node-red-contrib-ui-timelines-chart:latest
Install
npm install node-red-contrib-ui-timelines-chart
Note: This node uses APIs that require at least Node-RED 0.19 and Node-RED Dashboard 2.10.
Usage
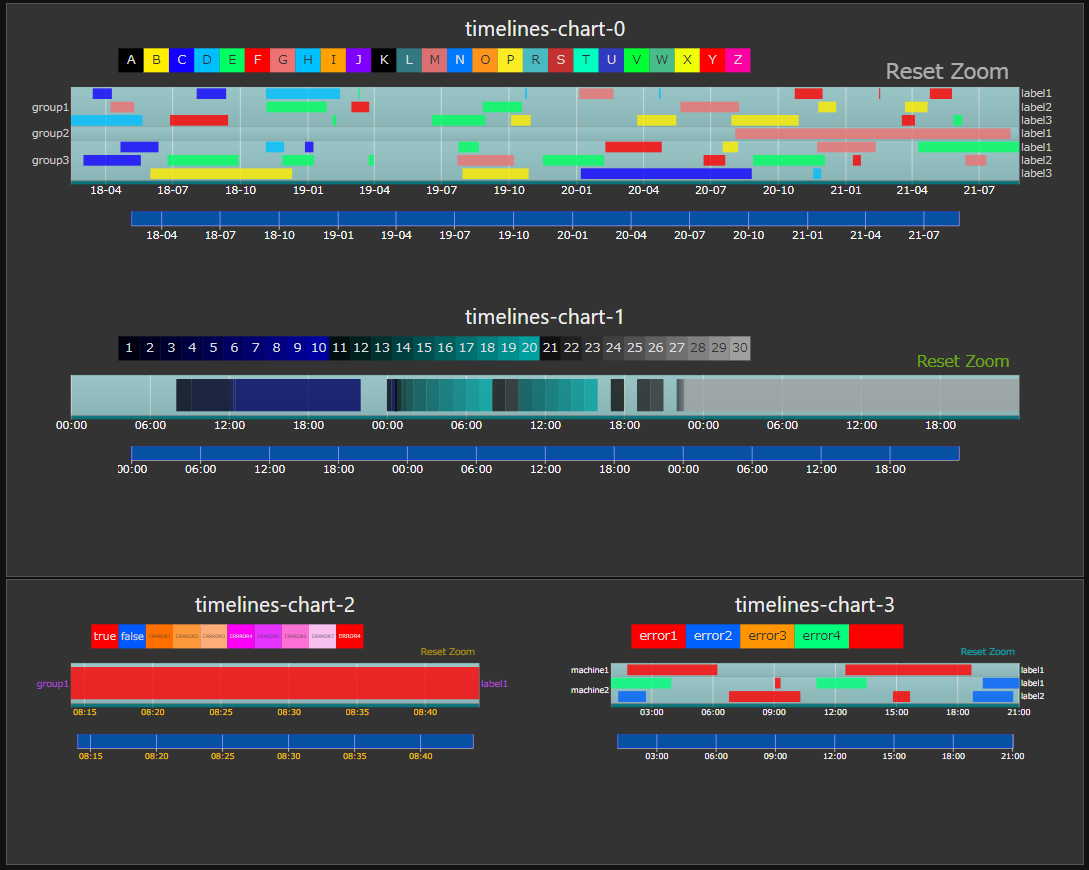
"ui-timelines-chart" node is a UI widget that can be used to display the timelines chart in the Node-RED dashboard.
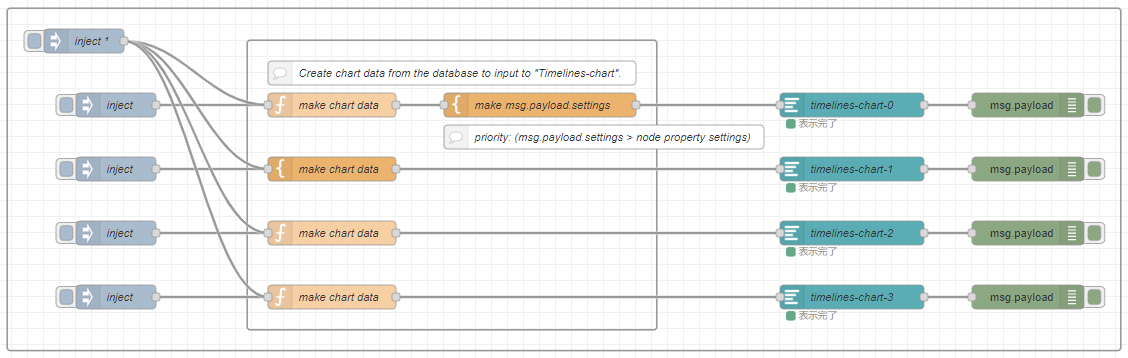
This Node-Red module can not directly connect to Database.
Widget properties
name
Set the node name to be displayed in flow.
group
Set the group to be displayed on the dashboard.
size
Set the size on the dashboard.
label
Set for the name to be displayed on the dashboard.
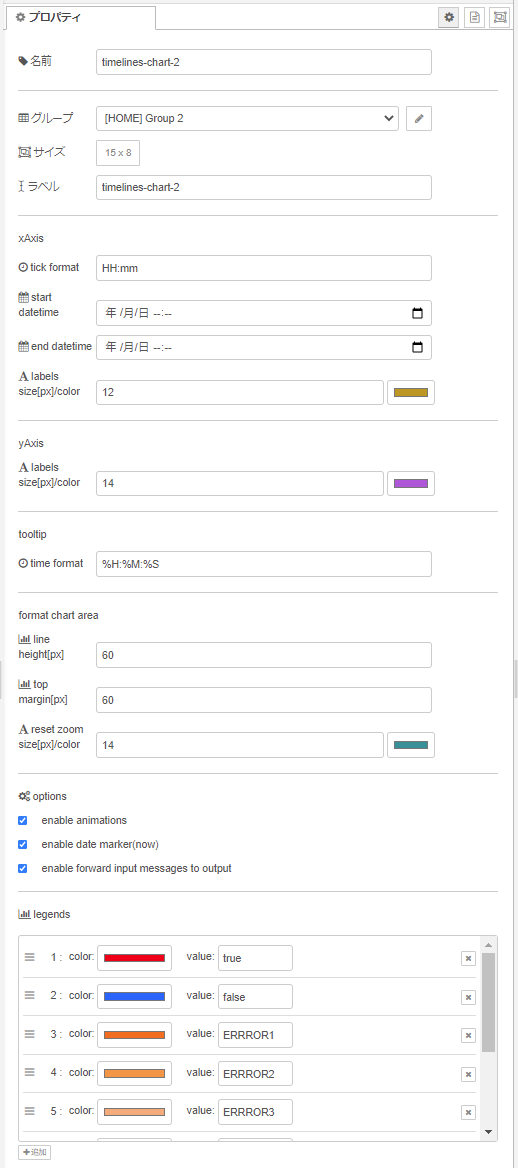
xAxis
tick format
Set the tick format of the X-Axis.
- YYYY-MM-DD HH:mm:ss - YYYY-MM-DD - HH:mm:ss - HH:mm - HH ....*ISO 8601 format
start date
Set the start time of the X-Axis. If not set, select the first data.
end date
Set the end time of the X-Axis. If not set, select the last data.
labels size[px]/color
Set the font size[in pixels] and font color to X-Axis label. size: from 0 to 64(default:16)
yAxis
labels size[px]/color
Set the font size[in pixels] and font color to Y-Axis label. size: from 0 to 64(default:16)
tooltips
time format
Set the time format of tooltips. See d3-time-format for available options.
format chart area
chart top margin[px]
Set the top margin of the chart, in pixels. height: from 0 to 255(default:60)
chart height[px]
Set the chart maximum height of each line, in pixels. height: from 1 to 255(default:60)
reset zoom label size[px]/color
Set the font size[in pixels] and font color to reset zoom label. size: from 0 to 64(default:24)
options
enable animations
Set whether to animate transitions.
enable date marker(now)
Set whether to display the current date of the vertical line.
enable forward input messages
Set whether to forward input messages to output.
legends
Set the
colorandvalueto be displayed on the chart.
Input items
An array of Items is passed in by msg.payload. It consists of objects containing the following properties.
[Data syntax]
{
    dataItems:[
        {
            group: "group1name",
            data: [
            {
                label: "label1name",
                data: [
                {
                    timeRange: [<date>, <date>],
                    val: <val: number (continuous dataScale) or string (ordinal dataScale)>
                },
                {
                    timeRange: [<date>, <date>],
                    val: <val>
                },
                (...)
                ]
            },
            {
                label: "label2name",
                data: [...]
            },
            (...)
            ],
        },
        {
            group: "group2name",
            data: [...]
        },
        (...)
    ],
    settings:{
        xAxis:{
            tickFormat: <val: string (date time[default:YYYY-MM-DD HH:mm:ss])>,
            startDateTime: <date>,
            endDateTime: <date>,
            labelsFontSize: <val: number (from 0 to 64[default:16])>
            labelsColor: <val: string (from #000000 to #ffffff[default:#000000])>
        },
        yAxis:{
            labelsFontSize: <val: number (from 0 to 64[default:16])>
            labelsColor: <val: string (from #000000 to #ffffff[default:#000000])>
        },
        tooltips:{
          timeFormat: <val: string (d3-time-format[default:%Y-%m-%d %H:%M:%S])>,
        }
        chart:{
          topMargin: <val: number (from 0 to 255[default:60])>
          height: <val: number (from 1 to 255[default:60])>
          resetZoom:{
              labelFontSize: <val: number (from 0 to 64[default:24])>
              labelColor: <val: string (from #000000 to #ffffff[default:#000000])>
          },
          lineColors <{val: string (from #000000 to #ffffff[default:#000000]), val: string (label name)}>,
        },
        options:{
          enableAnimations: <boolean>,
          enableDateMarker: <boolean>,
          forwardInputMessages: <boolean>
        }
    }
}
priority: (msg.payload.settings > node property settings)
npm-scripts
There are some npm-scripts to help developments.
- npm install - Install the testing environment in your project.
- npm run build - Make
./data/my-nodedirectory from thesrcdirectory and Install the my-node in Node-RED. - npm run start - Start Node-RED.
"http://localhost:1880"
file list
[root]
│  package.json
│  README.md
│  tsconfig.json
│
├─data -> `Node-Red work files`
│  │
│  ├─my-node -> `project files` The resource files and built files should be placed here.
│  │  │  package.json
│  │  │
│  │  └─nodes -> The resource files and built files should be placed here.
│  │     └─...
│  │
│  └─node_modules
│     └─...
│
├─dist -> `The project built files`
├─examples -> `node-RED flow files`
├─figs
└─src
    └─nodes -> project files
        ├─icons
        ├─lib
        ├─locales
        │  ├─en-US
        │  └─ja
        └─test