node-red-contrib-ui-heatmap 2.2.1
A Node Red node to show a heat map
node-red-contrib-ui-heatmap
A Node Red node to show a heat map (based on the heatmap.js library).
Install
Run the following npm command in your Node-RED user directory (typically ~/.node-red):
npm install node-red-contrib-ui-heatmap
CAUTION: Version 2.0.0 contains a breaking change!!! After upgrading from an older version to version 2.0.0 (or above), you will get following error:

To solve this, you will need to remove your old heatmap nodes in the flow and replace them by new heatmap nodes. Or if you are an experienced user, you can replace the node type 'heat-map' by 'ui_heat_map' in your flow JSON file.
Support my Node-RED developments
Please buy my wife a coffee to keep her happy, while I am busy developing Node-RED stuff for you ...
Node Usage
A heatmap (or temperature map) is a graphical representation of data, where the input values (contained in a matrix) are represented as colors. Low numeric input numbers will be represented in the heatmap as blue, while high numeric numbers will be represented as red. All other numbers in between will be represented by intermediate colors.
All the flows from this page are also available via the menu in the Node-RED flow editor (Import->Examples->Ui heatmap).
Example flow
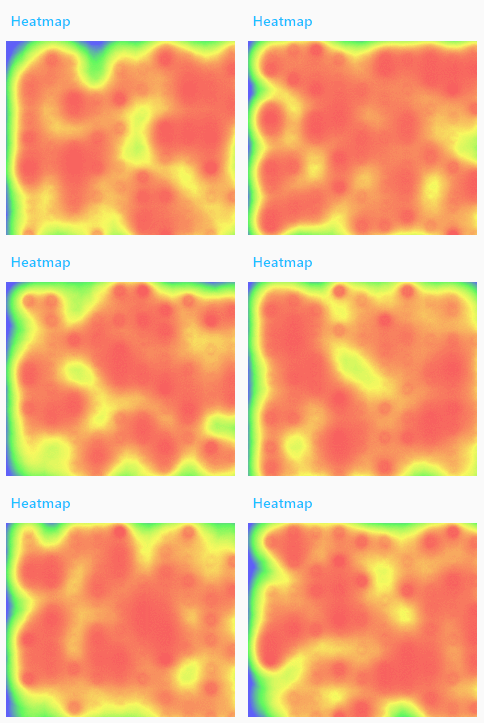
In the following example flow an array of 200 random values will be calculated, and those values will be visualised in a heatmap of 20x10 size:

[{"id":"948d15ed.a58878","type":"function","z":"5a89baed.89e9c4","name":"Generate random matrix","func":"// Generate some random data\n// See https://www.patrick-wied.at/static/heatmapjs/example-minimal-config.html\nvar len = 200;\n\nmsg.payload = [];\n\nwhile (len--) {\n var value = Math.floor(Math.random()*100);\n msg.payload.push(value);\n}\n\nreturn msg;","outputs":1,"noerr":0,"x":600,"y":2340,"wires":[["a9e0a477.fdca68"]]},{"id":"cac56ba6.c46e18","type":"inject","z":"5a89baed.89e9c4","name":"Show heatmap","topic":"","payload":"","payloadType":"date","repeat":"","crontab":"","once":true,"onceDelay":0.1,"x":370,"y":2340,"wires":[["948d15ed.a58878"]]},{"id":"a9e0a477.fdca68","type":"ui_heat_map","z":"5a89baed.89e9c4","group":"2e442781.0c5608","order":0,"width":"6","height":"5","name":"","rows":"20","columns":"10","minMax":false,"minimumValue":0,"maximumValue":0,"backgroundType":"color","backgroundColor":"#ffffff","radius":40,"opacity":0.6,"blur":0.85,"showValues":false,"gridType":"none","valuesDecimals":0,"showLegend":false,"legendType":"none","legendDecimals":0,"legendCount":2,"x":820,"y":2340,"wires":[]},{"id":"2e442781.0c5608","type":"ui_group","z":"","name":"Default","tab":"4779176.99cd2e8","disp":true,"width":"6","collapse":false},{"id":"4779176.99cd2e8","type":"ui_tab","z":"","name":"Home","icon":"dashboard","disabled":false,"hidden":false}]
The resulting heatmap will be updated every second by the inject node:
Input matrix
The matrix of input numbers needs to be specified in msg.payload as an array. The length of the array should always be equal to the number of grid cells, i.e. equal to rows x columns. The input array can be specified in multiple formats:
An array of numbers (like e.g.
[ 0, 1, 2, 3, 4, 5, 6, ... ]), which will be drawn from left to right and from top to bottom: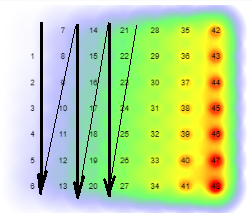
[{"id":"6ab823cc.efc3fc","type":"function","z":"5a89baed.89e9c4","name":"Generate ascending matrix","func":"// Generate some random data\n// See https://www.patrick-wied.at/static/heatmapjs/example-minimal-config.html\nmsg.payload = [];\n\nfor (var i = 0; i < 49; i++) {\n msg.payload.push(i);\n}\n\nreturn msg;","outputs":1,"noerr":0,"x":500,"y":1820,"wires":[["8dd1a0f5.7e69e"]]},{"id":"7f7768.95c9b898","type":"inject","z":"5a89baed.89e9c4","name":"Show heatmap","topic":"","payload":"","payloadType":"date","repeat":"","crontab":"","once":true,"onceDelay":0.1,"x":260,"y":1820,"wires":[["6ab823cc.efc3fc"]]},{"id":"8dd1a0f5.7e69e","type":"ui_heat_map","z":"5a89baed.89e9c4","group":"143de3c.3c1901c","order":0,"width":"6","height":"5","name":"","rows":"7","columns":"7","minMax":false,"minimumValue":0,"maximumValue":0,"backgroundType":"image","backgroundColor":"#ff80c0","radius":40,"opacity":"0","blur":0.85,"showValues":false,"gridType":"vals","valuesDecimals":0,"showLegend":false,"legendType":"none","legendDecimals":0,"legendCount":2,"x":720,"y":1820,"wires":[]},{"id":"143de3c.3c1901c","type":"ui_group","z":"","name":"Heatmap","tab":"4e49ccae.5e3364","disp":true,"width":"6","collapse":false},{"id":"4e49ccae.5e3364","type":"ui_tab","z":"","name":"Heatmap","icon":"dashboard","disabled":false,"hidden":false}]An array of key/value pairs (like e.g.
[ { key0: 0 }, { key1: 1}, { key2: 2}, { key3: 3}, ... ]) where the values need to be numbers. And every array element (object) is only allowed to have a single key/value pair, so e.g.[ { key0: 0, key1: 1}, ... }is not allowed.An array which contains a mix of numbers and key/value pairs (like e.g.
[ { key0: 0 }, 1, 2, { key3: 3}, ... ]).[{"id":"24236b6b.9ffc64","type":"function","z":"5a89baed.89e9c4","name":"Mix of values and key-value pairs","func":"// Generate some random data\n// See https://www.patrick-wied.at/static/heatmapjs/example-minimal-config.html\nmsg.payload = [];\n\nfor (var i = 0; i < 49; i++) {\n var value = Math.floor(Math.random()*100);\n if (i % 2 === 0) {\n var pair = {};\n pair['key' + i] = value;\n msg.payload.push(pair);\n }\n else {\n msg.payload.push(value);\n }\n}\n\nreturn msg;","outputs":1,"noerr":0,"x":520,"y":1700,"wires":[["fe91d79b.3b9be8"]]},{"id":"4372ce10.a3309","type":"inject","z":"5a89baed.89e9c4","name":"Show heatmap","topic":"","payload":"","payloadType":"date","repeat":"","crontab":"","once":true,"onceDelay":0.1,"x":260,"y":1700,"wires":[["24236b6b.9ffc64"]]},{"id":"fe91d79b.3b9be8","type":"ui_heat_map","z":"5a89baed.89e9c4","group":"143de3c.3c1901c","order":0,"width":"6","height":"5","name":"","rows":"7","columns":"7","minMax":false,"minimumValue":0,"maximumValue":0,"backgroundType":"image","backgroundColor":"#ff80c0","radius":40,"opacity":"0","blur":0.85,"showValues":false,"gridType":"keys","valuesDecimals":0,"showLegend":false,"legendType":"vals","legendDecimals":0,"legendCount":2,"x":760,"y":1700,"wires":[]},{"id":"143de3c.3c1901c","type":"ui_group","z":"","name":"Heatmap","tab":"4e49ccae.5e3364","disp":true,"width":"6","collapse":false},{"id":"4e49ccae.5e3364","type":"ui_tab","z":"","name":"Heatmap","icon":"dashboard","disabled":false,"hidden":false}]
CAUTION: Only integer numbers are supported! If e.g. input numbers between 0.0 and 1.0 need to be displayed, then it is required to convert those decimal numbers to integer numbers before they are injected into this node...
Troubleshooting
If no heatmap is being drawn, you might check the following:
- Make sure you have injected a matrix of values. When no values have been injected, nothing can be drawn...
- Check the Node-RED log whether there are validation errors about the content of the input matrix.
- Finally you can check the browser log for exceptions.
Node configuration
Grid size (rows & columns)
Define the number of rows and columns, i.e. the size of the matrix that will contain all the individual numeric values (which will be represented visually as colors in the heatmap). The size can dynamically overridden by adding msg.rows and msg.columns in the input message.
CAUTION: the product of rows * columns should equal to the length of the input array!
In other words, you need to specify a numeric value for 'every' cell in the result matrix.
Specify minimum and maximum value
The minimum value will be represented as blue, while the maximum value will be represented as red. There are three ways to specify the minimum and maximum numbers:
When this checkbox is selected, then the minimum and maximum numbers need to be specified manually.
- Advantage: This is the most precise method.
- Disadvantage: You need to know both values in advance.
When this checkbox is unselected, then the minimum and maximum values can be specified in the input message (as
msg.minimumandmsg.maximum).- Advantage: This is a dynamic solution.
- Disadvantage: The flow becomes a bit more complex, since you need extra nodes to specify the values.

[{"id":"574d92ae.13191c","type":"function","z":"ae5f2a27.a96178","name":"Generate random matrix between limits","func":"// Generate some random data\n// See https://www.patrick-wied.at/static/heatmapjs/example-minimal-config.html\nvar len = 200;\n\nmsg.payload = [];\n\nwhile (len--) {\n // Generate a random number between min and max (both included)\n var value = Math.floor(Math.random() * (msg.maximum - msg.minimum + 1) ) + msg.minimum;\n msg.payload.push(value);\n}\n\nreturn msg;","outputs":1,"noerr":0,"x":900,"y":820,"wires":[["745ee557.1d22bc"]]},{"id":"885bd880.e27758","type":"inject","z":"ae5f2a27.a96178","name":"Show heatmap","topic":"","payload":"","payloadType":"date","repeat":"","crontab":"","once":true,"onceDelay":0.1,"x":460,"y":820,"wires":[["c2770ab4.101dd8"]]},{"id":"745ee557.1d22bc","type":"ui_heat_map","z":"ae5f2a27.a96178","group":"9edbe6bb.223538","order":0,"width":"6","height":"5","name":"","rows":"20","columns":"10","minMax":false,"minimumValue":0,"maximumValue":0,"backgroundType":"color","backgroundColor":"#ffffff","radius":40,"opacity":0.6,"blur":0.85,"showValues":false,"gridType":"none","valuesDecimals":0,"showLegend":false,"legendType":"none","legendDecimals":0,"legendCount":2,"x":1160,"y":820,"wires":[]},{"id":"c2770ab4.101dd8","type":"change","z":"ae5f2a27.a96178","name":"Set limits","rules":[{"t":"set","p":"minimum","pt":"msg","to":"10","tot":"num"},{"t":"set","p":"maximum","pt":"msg","to":"90","tot":"num"}],"action":"","property":"","from":"","to":"","reg":false,"x":640,"y":820,"wires":[["574d92ae.13191c"]]},{"id":"9edbe6bb.223538","type":"ui_group","z":"","name":"Default","tab":"9f234791.ecbac8","disp":true,"width":"6","collapse":false},{"id":"9f234791.ecbac8","type":"ui_tab","z":"","name":"Home","icon":"dashboard","disabled":false,"hidden":false}]When this checkbox is unselected and the input message contains no limits, then the node will calculate automatically the minimum and maximum (based on the input matrix numbers).
- Advantage: This is the simplest solution.
- Disadvantage: The colors might be a bit incorrect. Indeed when the input matrix numbers don't contain the highest and lowest numbers, then the he colors will deviate a bit from the real situation.
Grid values
Specify which data (from the matrix of input values) need to be drawn on top of the heatmap.
None: no data will be drawn on top of the heatmap.
Values: the numeric values will be drawn (normal numbers of numeric values from the key/value pairs). These values will always be available, since otherwise the heatmap cannot be drawn at all.
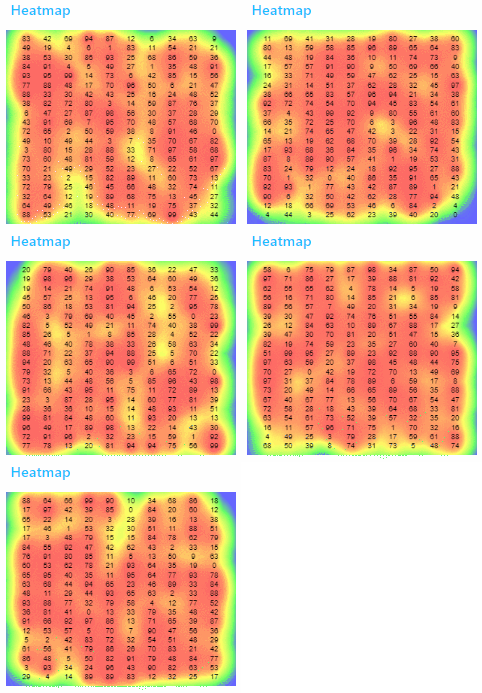
In the 'decimals' field, the number of decimal places can be specified. The number will be rounded to the nearest value.
Keys: the key values will be drawn. When no key/value pair is available for a certain grid cell, there will be no key shown in that specific grid cell.
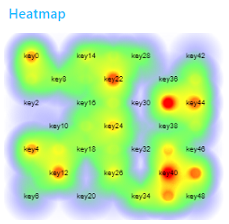
Legend
When 'values' is selected, a legend will be displayed horizontally below the heatmap. Moreover a 'Dimension' field will become visible, which allows to change how many numbers need to be displayed in the legend.
For example when the Legend nr. is6:
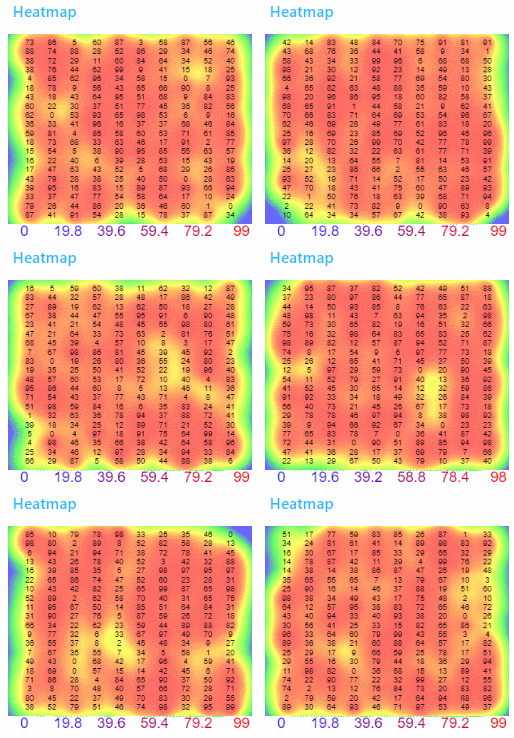
In the 'decimals' field, the number of decimal places can be specified. The number will be rounded to the nearest value.
Remark: the numbers will be displayed in the same colour that would be used to represent that number in the heatmap.
Background
Specify which data needs to be displayed behind the heatmap:
None: No data will be drawn, which means the background will be transparent.
Fixed color: The color (specified in the color picker field) will be drawn in the background.
Image: an image will be drawn as background image. That background image can be specified via
msg.image. It is possible to send an input message only containing a background image, or a message that also contains a matrix (in the payload):
[{"id":"68b11d7f.6d0304","type":"function","z":"5a89baed.89e9c4","name":"Generate football pattern","func":"// Generate some random data\n// See https://www.patrick-wied.at/static/heatmapjs/example-minimal-config.html\nmsg.payload = [];\n\nconst values = [4, 11, 18, 25, 32, 39, 46];\n\nvar index = context.get('value_index') || 0;\n\nif (index >= 8) {\n index = 0;\n}\n\nfor (var i = 0; i < 49; i++) {\n if ( i === values[index]) {\n msg.payload.push(100);\n }\n else {\n msg.payload.push(0);\n }\n}\n\nindex += 1;\ncontext.set('value_index', index);\n\nreturn msg;","outputs":1,"noerr":0,"x":830,"y":2080,"wires":[["97f63078.7e2c3"]]},{"id":"c6664df3.f7f75","type":"inject","z":"5a89baed.89e9c4","name":"Show heatmap","topic":"","payload":"","payloadType":"date","repeat":"1","crontab":"","once":true,"onceDelay":0.1,"x":600,"y":2080,"wires":[["68b11d7f.6d0304"]]},{"id":"17380f74.c6d931","type":"inject","z":"5a89baed.89e9c4","name":"Show background","topic":"","payload":"","payloadType":"date","repeat":"","crontab":"","once":false,"onceDelay":0.1,"x":270,"y":2040,"wires":[["5c3b071b.6e1f58"]]},{"id":"5c3b071b.6e1f58","type":"http request","z":"5a89baed.89e9c4","name":"Download image","method":"GET","ret":"bin","paytoqs":false,"url":"http://www.soccer-training-methods.com/images/soccerfieldpic.jpg","tls":"","proxy":"","authType":"basic","x":490,"y":2040,"wires":[["724e99a2.88e2c8"]]},{"id":"fe88576b.186cc8","type":"change","z":"5a89baed.89e9c4","name":"","rules":[{"t":"move","p":"payload","pt":"msg","to":"image","tot":"msg"}],"action":"","property":"","from":"","to":"","reg":false,"x":870,"y":2040,"wires":[["97f63078.7e2c3"]]},{"id":"724e99a2.88e2c8","type":"base64","z":"5a89baed.89e9c4","name":"","action":"","property":"payload","x":680,"y":2040,"wires":[["fe88576b.186cc8"]]},{"id":"97f63078.7e2c3","type":"ui_heat_map","z":"5a89baed.89e9c4","group":"143de3c.3c1901c","order":0,"width":"6","height":"5","name":"","rows":"7","columns":"7","minMax":false,"minimumValue":0,"maximumValue":0,"backgroundType":"image","backgroundColor":"#ff80c0","radius":40,"opacity":"0","blur":0.85,"showValues":false,"gridType":"keys","valuesDecimals":0,"showLegend":false,"legendType":"none","legendDecimals":0,"legendCount":2,"x":1060,"y":2060,"wires":[]},{"id":"143de3c.3c1901c","type":"ui_group","z":"","name":"Heatmap","tab":"4e49ccae.5e3364","disp":true,"width":"6","collapse":false},{"id":"4e49ccae.5e3364","type":"ui_tab","z":"","name":"Heatmap","icon":"dashboard","disabled":false,"hidden":false}]The image will be stretched automatically to fit the heatmap widget, with following result:
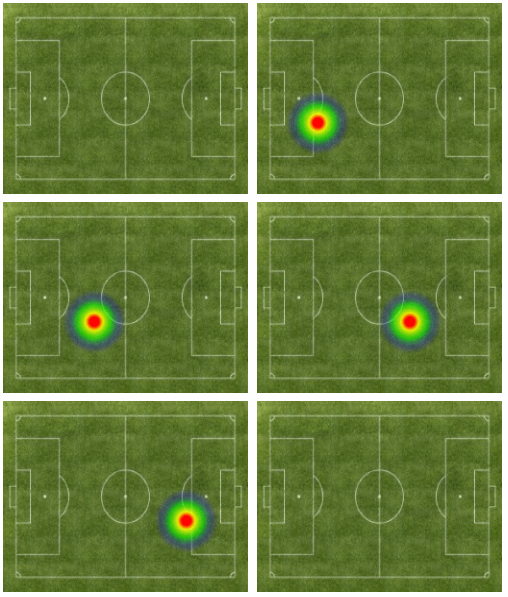
CAUTION: The opacity property should be 0 (or a value close to 0), otherwise the background image won't be clearly visible!
Snapshot
Specify whether a (base64 encoded) jpeg snapshot image (of the heatmap) should be send in the msg.payload of an output message:
- Never: the image will never be created or send.
- Always: the image will be created and send for every input message.
- At request: the image will only be created when an input message with
msg.snapshot=truearrives.- When the
msg.payloadalso contains an array, then first the heatmap will be regenerated (based on the array values). And afterwards the snapshot of this new heatmap will be send. - When the
msg.payloaddoes not contains an array, then the snapshot (of the previous heatmap) will be send.
- When the
The following example flow demonstrates the possible scenario's:

[{"id":"1c6c035e.67de0d","type":"function","z":"2b6f5d19.202242","name":"Generate random matrix","func":"// Generate some random data\n// See https://www.patrick-wied.at/static/heatmapjs/example-minimal-config.html\nvar len = 200;\n\nmsg.payload = [];\n\nwhile (len--) {\n var value = Math.floor(Math.random()*100);\n msg.payload.push(value);\n}\n\nreturn msg;","outputs":1,"noerr":0,"x":550,"y":720,"wires":[["8d9577d5.393358"]]},{"id":"7b9a2303.663d1c","type":"inject","z":"2b6f5d19.202242","name":"Show heatmap","props":[{"p":"payload"}],"repeat":"","crontab":"","once":true,"onceDelay":0.1,"topic":"","payload":"","payloadType":"date","x":180,"y":720,"wires":[["1c6c035e.67de0d"]]},{"id":"8d9577d5.393358","type":"ui_heat_map","z":"2b6f5d19.202242","group":"2e442781.0c5608","order":0,"width":"6","height":"5","name":"","rows":"20","columns":"10","minMax":false,"minimumValue":0,"maximumValue":0,"backgroundType":"color","backgroundColor":"#ffffff","image":"request","radius":40,"opacity":0.6,"blur":0.85,"showValues":false,"gridType":"none","valuesDecimals":0,"showLegend":false,"legendType":"none","legendDecimals":0,"legendCount":2,"x":800,"y":720,"wires":[["a111d65c.d7be98"]]},{"id":"a111d65c.d7be98","type":"image","z":"2b6f5d19.202242","name":"","width":160,"data":"payload","dataType":"msg","thumbnail":false,"active":true,"pass":false,"outputs":0,"x":1000,"y":720,"wires":[]},{"id":"7911161f.a440a8","type":"inject","z":"2b6f5d19.202242","name":"Show heatmap + get snapshot","props":[{"p":"payload"},{"p":"topic","vt":"str"},{"p":"snapshot","v":"true","vt":"bool"}],"repeat":"","crontab":"","once":true,"onceDelay":0.1,"topic":"","payload":"","payloadType":"date","x":230,"y":780,"wires":[["1c6c035e.67de0d"]]},{"id":"3a705f1a.5772c","type":"inject","z":"2b6f5d19.202242","name":"Get snapshot","props":[{"p":"snapshot","v":"true","vt":"bool"}],"repeat":"","crontab":"","once":true,"onceDelay":0.1,"topic":"","x":580,"y":780,"wires":[["8d9577d5.393358"]]},{"id":"2e442781.0c5608","type":"ui_group","name":"Heatmap","tab":"4779176.99cd2e8","order":1,"disp":true,"width":"6","collapse":true},{"id":"4779176.99cd2e8","type":"ui_tab","name":"Home","icon":"dashboard","disabled":false,"hidden":false}]
Note that the node-red-contrib-image-output node should be installed to run this flow.
The following demo shows that a jpeg will be send to the output, for every input message that arrives:

Note the above flow is in fact not really useful. When the server side nodes inject a snapshot message, we will get N duplicate snapshots when N dashboards are showing the heatmap at this moment. And when no dashboard is open, no snapshot will be send. So the snapshot option is only useful when triggered by a user action on the dashboard (e.g. a user clicks a 'create snapshot' button)!
Radius
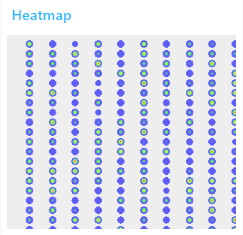
Each point in the input matrix will have a radius, to avoid a blocky map for low-resolution matrices.
In the next example, the radius is set to 5 which means the individual circles will become visible in this low-resolution (20x10) heatmap:
Opacity
The opacity of the heatmap defines the transparency of the colors, and will be a value between 0 and 1.
Blur
The higher the blur is, the smoother the color gradients will become. The blur will be a value between 0 and 1.
Step by step example
In the following example, we will generate a heatmap for a people counting system. This can be used e.g. to analyze which products are popular in a supermarket.
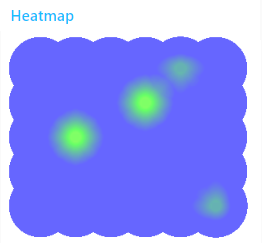
Divide the room area in rows and colums, and count the persons in each cell of that grid. The people counting system itself is not in scope of this tutorial! The result would be something like this, in case of a 5 x 6 grid:
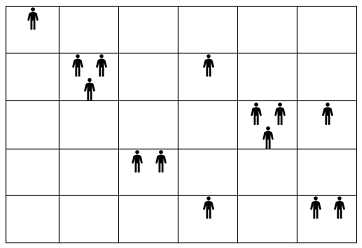
This means the following grid will be calculated:

Such a grid need to be injected into the heatmap node as an array:

Configure the heatmap node as a 5 x 6 grid:
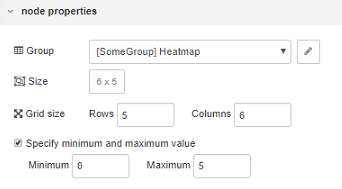
Remark: in this example the assumption has been made that maximum 5 persons can be in a single cell area at the same time.
And then the heatmap will visualize the grid that has been injected:
The flow of this example:
[{"id":"52c9564d.501378","type":"ui_heat_map","z":"5a89baed.89e9c4","group":"9b8440da.6819d","order":1,"width":"6","height":"5","name":"","rows":"5","columns":"6","minMax":true,"minimumValue":0,"maximumValue":"5","backgroundType":"color","backgroundColor":"#ffffff","radius":40,"opacity":0.6,"blur":0.85,"showValues":false,"gridType":"none","valuesDecimals":0,"showLegend":false,"legendType":"none","legendDecimals":0,"legendCount":2,"x":660,"y":2240,"wires":[]},{"id":"9be4f0a5.b7201","type":"inject","z":"5a89baed.89e9c4","name":"","topic":"","payload":"[ 1, 0, 0, 0, 0, 0, 0, 3, 0, 1, 0, 0, 0, 0, 0, 0, 3, 1, 0, 0, 2, 0, 0, 0, 0, 0, 0, 1, 0, 2 ]","payloadType":"json","repeat":"","crontab":"","once":false,"onceDelay":0.1,"x":510,"y":2240,"wires":[["52c9564d.501378"]]},{"id":"9b8440da.6819d","type":"ui_group","z":"","name":"Heatmap","tab":"16f3293b.5f0f67","disp":true,"width":"6","collapse":false},{"id":"16f3293b.5f0f67","type":"ui_tab","z":"","name":"SomeGroup","icon":"dashboard","disabled":false,"hidden":false}]
Use cases
Heatmaps can be used for a whole range of purposes:

