node-red-contrib-tetronik-daks-iot 1.1.0
Send signals from various systems to the highly available DAKS alarm server to trigger automated communication processes.
DAKS-IoT (node-red-contrib-tetronik-daks-iot)
Send signals from various systems to the highly available DAKS alarm server to trigger automated communication processes.
This package works only in combination with a tetronik DAKS and a valid ESPA-X session. For a redundant operation two DAKS servers are required, each with its own ESPA-X session.
- DAKS-IoT (node-red-contrib-tetronik-daks-iot)
Requirements
- at least one DAKS server (see https://tetronik.com)
- min. DAKS-Pro v8.14 / DAKS-Eco v2.10 - for specific information contact support
- local network connection (mandatory for this service)
- internet connection (only required for package installation/update)
- Ports 2023 (ESPA-X) and/or 2024 (ESPA-X TLS) not blocked
(if you changed those default ports in the DAKS, these "new" ports must not be blocked) - NodeRED >V2.0.0 installed
- dependencies (see
package.json) installed
Installation
The easiest way, to install this package, is to go to your NodeRED instance, open the menu (top right corner) and click on Manage palette. Switch to the Install tab and enter node-red-contrib-tetronik-daks-iot. Look for the package with the same spelling, click install and confirm in the shown popup with Install.
If you want to install the package from your command line, use the following commands.
Browse to your root directory of your NodeRED instance and run the following command:
npm install node-red-contrib-tetronik-daks-iot
If you habe problems with your installation, try these options on npm install to force an installation:
--unsafe-perm
If the installation succeds but your nodes still throw errors, check if the dependecies, as seen in the package.json, are all installed.
For environments without an open internet connection, you can upload an TGZ-Compressed file to your NodeRED instance, to install this package.
Just download it from the GitHub repository.
Update / Upgrade / Downgrade
Version changes can be seen in the Changelog.
NodeRED UI
To update this package with the help of your NodeRED web interface, open the menu (top right corner) and click Manage palette. In the tab Nodes, filter for node-red-contrib-tetronik-daks. If there is an update available, you will see a button Update to <<version>> in the corresponding container. Click on that button and confirm your update to get the latest version.
If you want to install a special version, please follow the command line description.
Command line (and special version)
For updating to the latest version, browse to your root directory of your NodeRED instance and run the following command:
npm update node-red-contrib-tetronik-daks-iot
If you want to install a special version or update to a special version, you first have to find out, which versions are available.
To display all possible versions of this package enter:
npm show node-red-contrib-tetronik-daks-iot@* version
Then install a special version with @M.M.P: (i.e.)
npm install [email protected]
SECURITY
You can find the security policy here.
Scenarios / Examples
Example 1 - ESPA-X
A simple First-Steps example. For this, only the DAKS access data and call parameters have to be entered, so that the connection and function of the nodes can be tested straightaway.
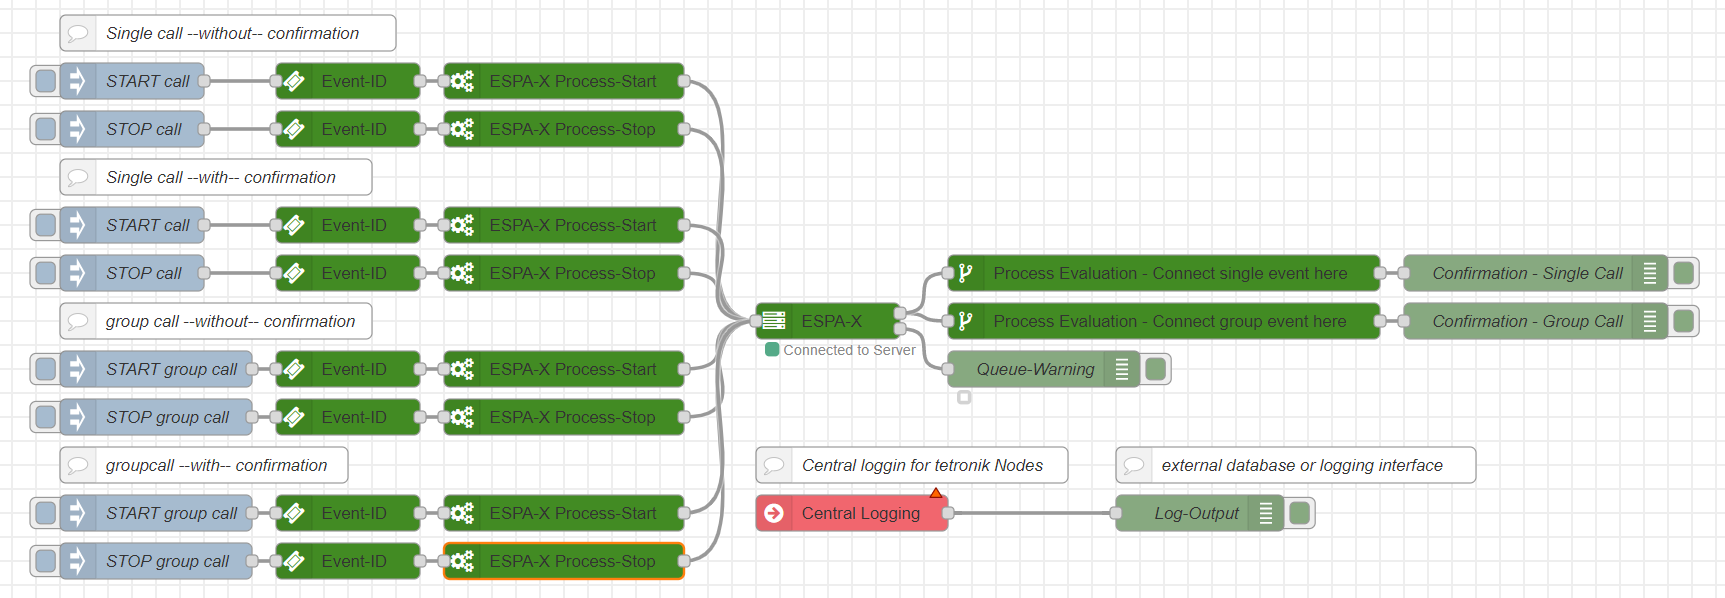
There is no specific use-case for this example. This example is only used for testing and approaching the ESPA-X node and the connection to the DAKS.
Example 2 - WAGO to ESPA-X
This example shows a WAGO-ModbusTCP module with eight digital inputs on the input side, which are supposed to control different processes on the DAKS.
A process (call) is started when the status changes from LOW to HIGH at input 1 and a process is stopped when the status changes from HIGH to LOW at input 2.
At input 3 a process is started with the help of a "switch" at HIGH and stopped if the state changes to LOW during process execution.

In this example different scenarios are possible. Digital/analog inputs are received from a WAGO-ModbusTCP module, processed/evaluated and a process is started at DAKS.The WAGO module can be connected to temperature sensors, pushbuttons/switches, doors or other building elements (e.g. for door monitoring, device monitoring, transport systems or assembly line monitoring) that need to start or stop a process. Modbus (or ModbusTCP) is the communication protocol for programmable logic controllers, which is used, for example, for actuators (e.g. relays for switching on electrical motors), electrical valves (e.g. for hydraulics or compressed air), but also modules for drive controllers (motion control, speed control with controlled acceleration or deceleration, stepper motor controllers).
Example 3 - Socket to ESPA-X
This example shows a TCP node on the input side (can be both server or client). This TCP socket receives strings in which the individual data records are partitioned with separators and the string is "terminated" with a carriage return. This is followed by a "splitter node", which splits the string into individual variables using predefined separators. Using these variables, a variable Event-ID is then created and another data set is created.
In addition, a certain variable in this string is used to decide whether the process is started or stopped.

This example can be used very well at terminal and printer outputs, where "endless" data sets are produced. Of course, individual data sets should always be separated by the same separator (often a carriage return) and all data sets should have the same basic structure. In this way, for example, the time, location, a message and a "control command" can always be filtered out of a data record in order to use it as a single variable in the flow.
However, if different data set structures can occur, this example is not suitable. Then the complex variant with a regular expression must be used.
Example 4 - Phasedetection and Overflow-Prevention
With the inject nodes at the beginning (as virtual input) and the debug nodes at the end (as virtual output) their functionality is demonstrated with the corresponding "limiter" nodes in between.
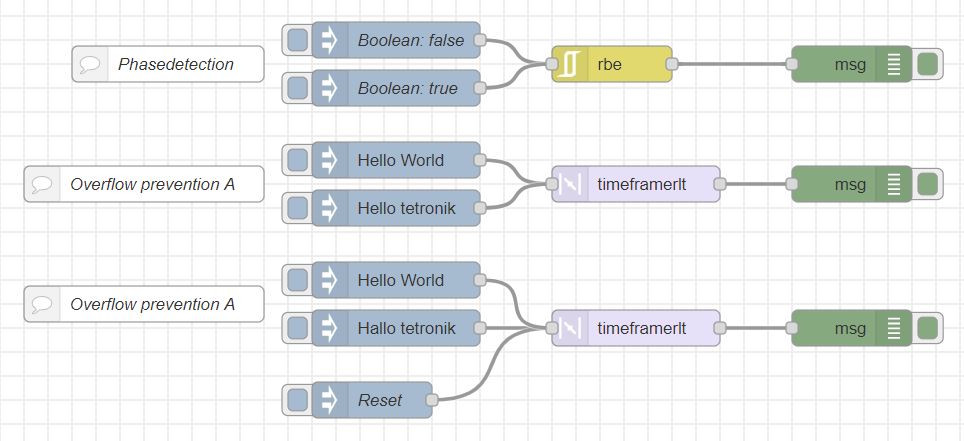
This example can be used on a wide range of inputs. However, it is especially helpful for direct digital and analog inputs. This is due to the fact that during an automatic regular query or a regular push, it often happens that the same data record is sent for a while, so that the same process would be started again and again, even though it is already running. Another challenge that can be overcome is message flooding, because a limiter can be used to set the maximum number of "messages" to a fixed amount per time.
Example 5 - Logging to Databases
A central logging node with all verified log connections at the end with a sample conversion (i.e. sample database tables).
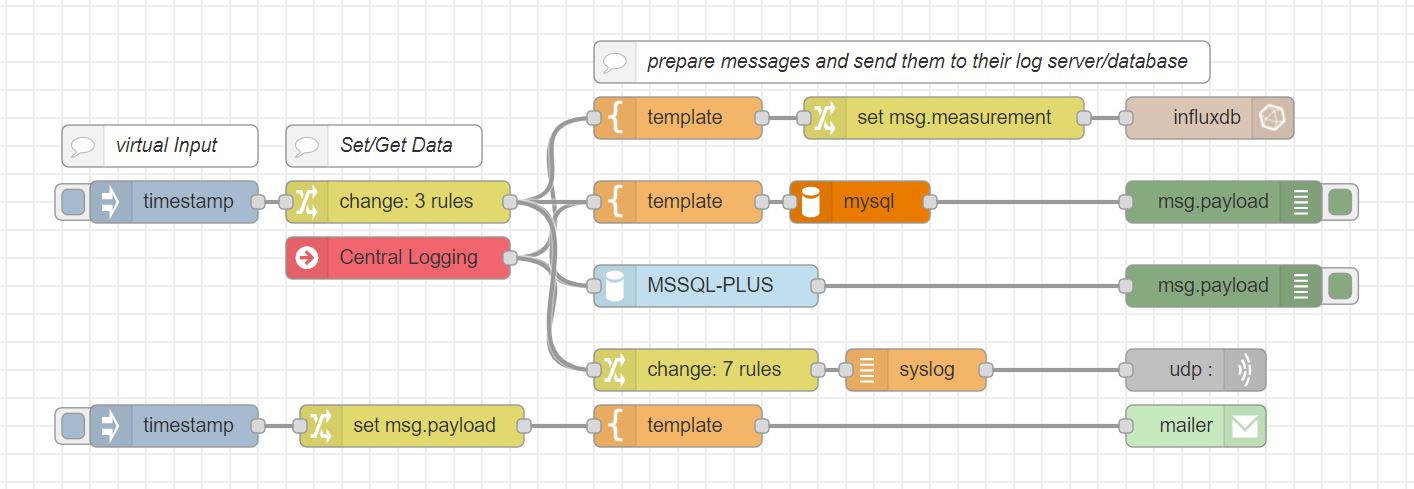
This example can be easily integrated into your own processes and database systems to enable central logging into different database systems (InfluxDB, MySQL, MSSQL, Syslog and SMTP). For this purpose, only the credentials and maybe database structures have to be adapted and then nothing more stands in the way of logging.
Example 6 - Dashboard
A dashboard solution that only needs to be connected with the appropriate tetronik log-connector.
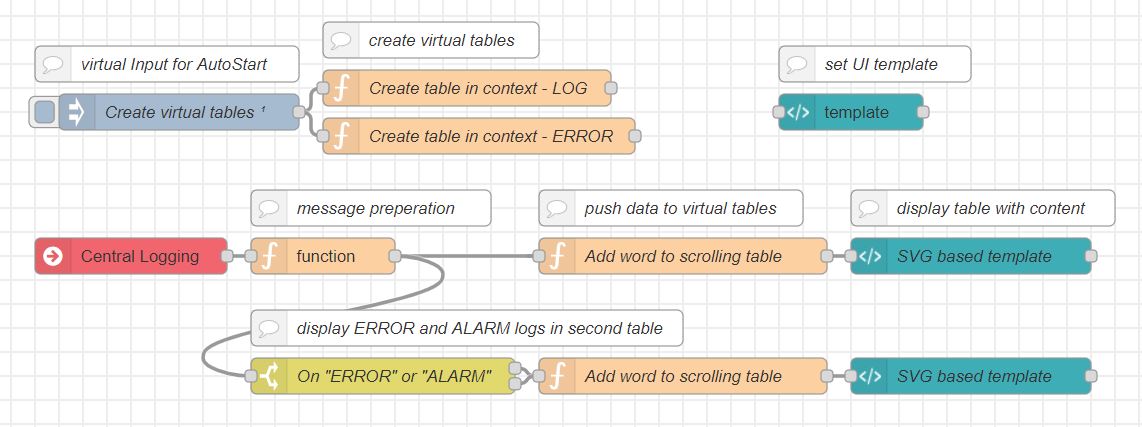
With this dashboard template logs, which are normally only written to an external database, can be displayed in NodeRed in parallel. The advantage over the web debug console is that the last 'n' entries are always available and the visual logging does not just start when the web application is started. Another advantage of this template is that there is an additional column for the "important" log entries, so that they can be noticed immediately and can be viewed together.
The demo template of the dashboard has a maximum of 500 entries. After reaching this number, the oldest entries will be overwritten.
Example 7 - Date/Time evaluation
With the inject nodes at the beginning (as virtual input) and the debug nodes at the end (as virtual output), the flows are steered in a certain direction with corresponding day/time evaluation nodes, as well as "switches", or upgraded with "time data".
This solution is suitable for individual broadcast triggering depending on time, weekdays, holidays, also in combination with cron jobs.
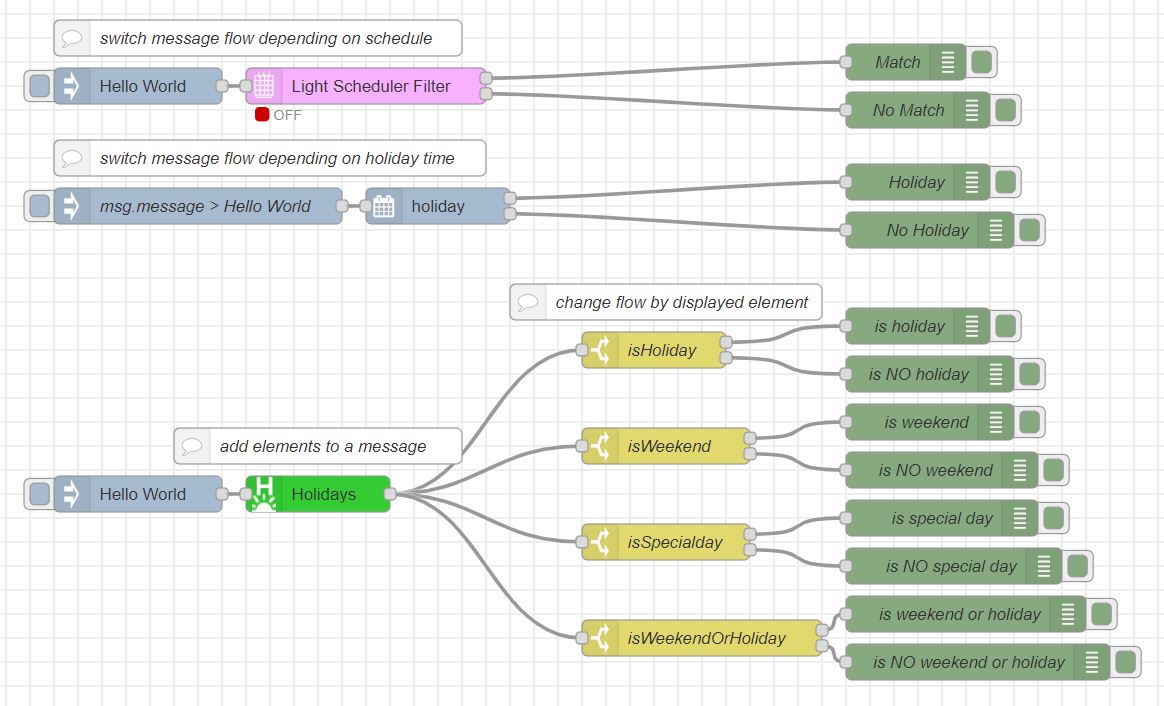
These examples can be used for time-based flow evaluations. For example, a flow can take a different route if there is nobody in the office on a holiday, or "messages" can be removed as "ok" because they occurred in a "normal" period and not in a "monitoring period".
Example 8 - OPC-UA
This example shows a few OPC-UA inputs with following evaluation and a few outputs for status feedback.

This example just gives a small overview of the possibilities of OPC-UA. For example, it is possible to listen to temperatures and thus react to changes. Or other mechanisms in the building can set certain variables to an "alarm value" so that other programs (like NodeRed) can react. OPC-UA also offers the possibility of not only reading values but also writing them back. This allows a value to be confirmed on a separate variable, or to simply activate a status lamp.
Example 9 - Ping
A simple example of pinging a network device. This type of check does not necessarily means that a device is not running, but it can be used to test, for example, whether only one device has failed or whether there is a network problem.
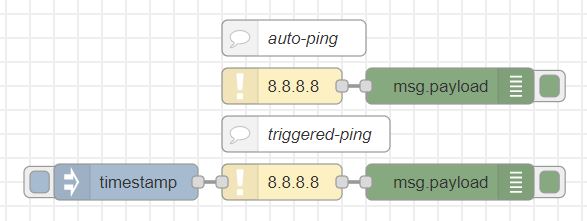
This example is very versatile. It can be used to find out if a service is even available before using resources to establish a real communication connection with it. Or it can be used for monitoring purposes, to trigger an alarm in case of a failure, if a service or even the network is no longer functional. Here the ping can be executed automatically every 'n' seconds or triggered by a previous flow.
Example 10 - catch third-party logs
This example shows different "inputs" which are channelled into a "Custom Central Logging Input" node to be used with the tetronik logging system.
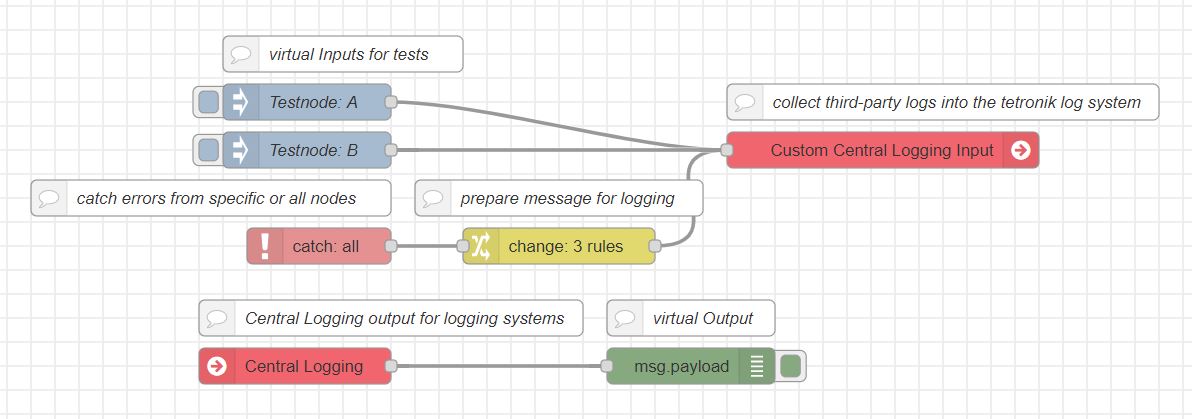
The "Custom Central Logging Input" node can be used in a variety of situations. There is no need to use this node, but it may make sense in a larger environment to connect to this node, since the "Central Logging" node is used for central log output of tetronik nodes. With this node, entries can be bundled and sent to one or more logging instances. In order to avoid having to establish a further log server connection, "third-party" logs can be included in the tetronik log system to provide a better overview of the nodes.
How to use
To trigger events on the DAKS, you need, beside your trigger event (i.e. inject node, modbus, tcp,...), from this package at least the nodes Event ID, ESPA-X Process and ESPA-X. It is also also recommended that you add one Central Logging node, to catch errors and warnings from the ESPA-X connection and the process-validation.
Logging
We implemented our own logging concept, beside the NodeRED ones, to generalize and sum all log events from our nodes.
To post-process our log events (i.e. to send it to a syslog/database server or to display it on an dashboard) you have to use the Central Logging node. There you select a "log connector". This log connector displays catches all logs from nodes, that selected the same connector.
Catch third-party log events
If you want to "catch" third-party events, to process them with the same log flow, you can get them with the Custom Central Logging Input node. In this node you simply pre-configure or pass data/parameters for the log event. You can also connect Status nodes with the Custom Central Logging Input, to catch logs/warnings/errors from nodes, that only throw them to NodeRED's debug console.
tetronik verified Packages
| Package Name | Version | Information | Certification status |
|---|---|---|---|
| node-red | 1.2.2 | :white_check_mark: | |
| node-red-contrib-bacnet | 0.2.4 | still in Beta | :b: |
| node-red-contrib-bool-gate | 1.0.2 | :white_check_mark: | |
| node-red-contrib-calc | 1.0.5 | :white_check_mark: | |
| node-red-contrib-cron-plus | 1.3.0 | :white_check_mark: | |
| node-red-contrib-german-holidays | 1.0.1 | separate evaluation | :white_check_mark: |
| node-red-contrib-holiday | 1.0.0 | :white_check_mark: | |
| node-red-contrib-influxdb | 0.5.1 | :white_check_mark: | |
| node-red-contrib-input-split | 0.1.0 | :white_check_mark: | |
| node-red-contrib-knx-ultimate | 1.1.92 | in evaluation | :small_orange_diamond: |
| node-red-contrib-light-scheduler | 0.0.16 | :white_check_mark: | |
| node-red-contrib-matrixbot | 0.0.2 | :white_check_mark: | |
| node-red-contrib-modbus | 5.13.3 | only Modbus-Read tested | :small_blue_diamond: |
| node-red-contrib-mssql-plus | 0.5.1 | in evaluation | :small_orange_diamond: |
| node-red-contrib-nodemailer-adapter | 1.0.0 | :white_check_mark: | |
| node-red-contrib-opcua | 0.2.88 | for professionals only | :white_check_mark: |
| node-red-contrib-ring-central | 0.0.4 | SMS only | :small_blue_diamond: |
| node-red-contrib-syslog | 1.1.0 | :white_check_mark: | |
| node-red-contrib-timeframerlt | 0.3.1 | :white_check_mark: | |
| node-red-contrib-ui-led | 0.3.3 | :white_check_mark: | |
| node-red-dashboard | 2.23.4 | :white_check_mark: | |
| node-red-node-mysql | 0.1.1 | :white_check_mark: | |
| node-red-node-ping | 0.2.1 | :white_check_mark: | |
| node-red-node-snmp | 0.0.25 | V1 and V2c only | :white_check_mark: |


