node-red-contrib-performance-monitor 2.0.0
Compact, Node-RED 5 native performance monitor: real-time CPU/memory/event-loop metrics, header HUD, node:sqlite history, flow node, and anomaly detection.
Node-RED Performance Monitor


![]()
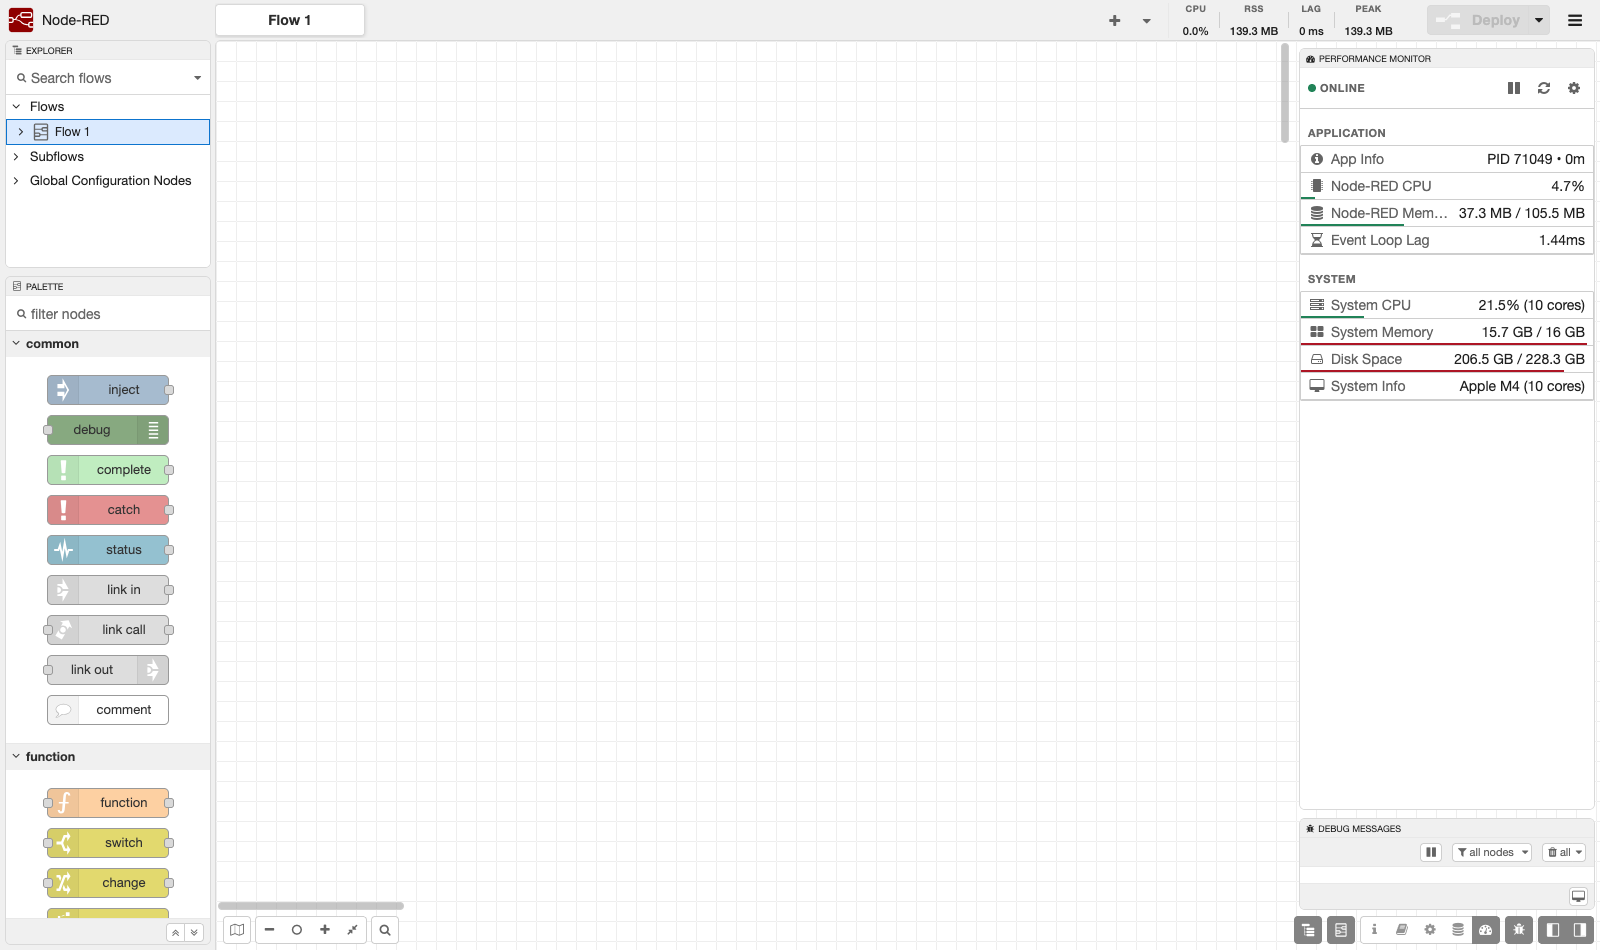
A native Performance Monitor for Node-RED. It adds a compact sidebar and a header HUD that show real-time process and system health, keeps queryable history in an embedded database, and raises alarms on anomalies — all themed to blend into the Node-RED editor (light and dark).
✨ Highlights
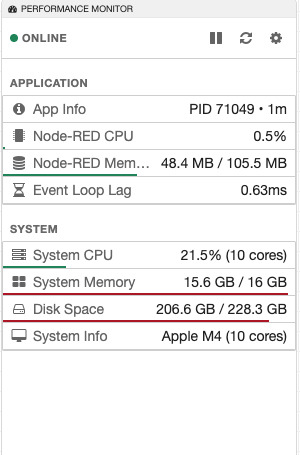
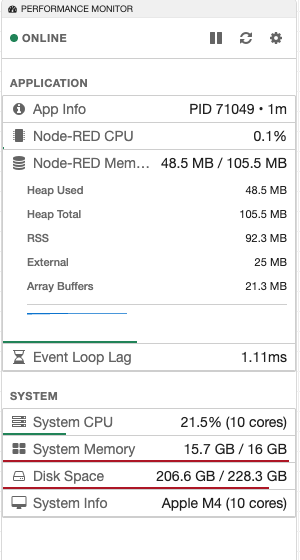
- Compact sidebar — every metric is a dense, single-line row; click any row to expand history and details. The whole monitor fits without scrolling.
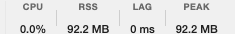
- Header HUD — CPU, RSS, event-loop lag and session-peak memory, always visible in the editor header (toggleable).
- Native theming — inherits Node-RED's own CSS variables, so it follows the editor's light/dark theme automatically. No custom themes to configure.
- Embedded history — metrics are stored in SQLite via Node's built-in
node:sqlite(no native build step), with configurable retention. - Flow node — a
perf-monitornode to read metrics inside your flows. - Anomaly detection — built-in CPU/heap/loop/traffic patterns plus user-defined fixed and statistical alarm rules.
- Historical report — a full-screen dashboard of past metrics over HTTP.
| Sidebar | Expanded row | Header HUD |
|---|---|---|
 |
 |
 |
🔍 What it monitors
- Node-RED process — CPU load, heap used/total, RSS, external & array-buffer memory, event-loop lag, PID, uptime.
- System — total CPU load (all cores), RAM usage, disk usage, CPU model/cores.
- Containers — detects cgroup v1/v2 limits (memory & CPU) and reports against the container's limits, not just the host's.
📦 Installation
From your Node-RED user directory (usually ~/.node-red):
npm install node-red-contrib-performance-monitor
Restart Node-RED. A Performance Monitor tab appears in the sidebar, and the HUD appears in the editor header.
✅ Compatibility
| Supported | |
|---|---|
| Node-RED | 4.x and 5.x (built and verified for Node-RED 5) |
| Node.js | ≥ 22.9 (uses the built-in node:sqlite module) |
| OS | macOS, Windows, Linux, Alpine, Raspberry Pi |
| Containers | Docker / Kubernetes (cgroup v1 & v2 aware) |
No native dependencies. History uses Node's built-in SQLite, so there is no
node-gyp/compiler step — installs cleanly on Alpine, ARM and minimal container images, and upgrades don't break on Node version changes. If SQLite is unavailable on the host runtime, the plugin automatically falls back to in-memory history instead of failing to load.
🔧 Configuration
Click the gear in the sidebar toolbar:
| Setting | Default | Description |
|---|---|---|
| Refresh interval | 2000 ms | Polling cadence (min 500 ms). |
| History retention | 7 days | How long to keep stored metrics. |
| Max DB size | 500 MB | Cap for the SQLite history database. |
| Hide header HUD | off | Toggle the editor-header widget. |
🌐 HTTP API
All routes are served under the Node-RED admin path:
| Method | Route | Purpose |
|---|---|---|
| GET | /performance-monitor/stats |
Current process + system snapshot |
| GET | /performance-monitor/recent |
Recent samples |
| GET | /performance-monitor/range |
Samples in a time range (optional bucketing) |
| GET | /performance-monitor/summary |
min/max/avg/p95 over a window |
| GET | /performance-monitor/stream |
Server-sent live sample stream |
| GET | /performance-monitor/report |
Full-screen historical dashboard |
| GET/POST | /performance-monitor/settings |
Read / update settings |
| GET/POST/PUT/DELETE | /performance-monitor/alarm-rules |
Manage anomaly alarm rules |
🤝 License
MIT — see LICENSE.