node-red-contrib-opentelemetry 1.6.4
Distributed tracing with OpenTelemetry SDK and Prometheus metrics exporter for Node-RED
Node-RED OpenTelemetry
Distributed tracing with OpenTelemetry SDK and Prometheus metrics exporter for Node-RED
Key features
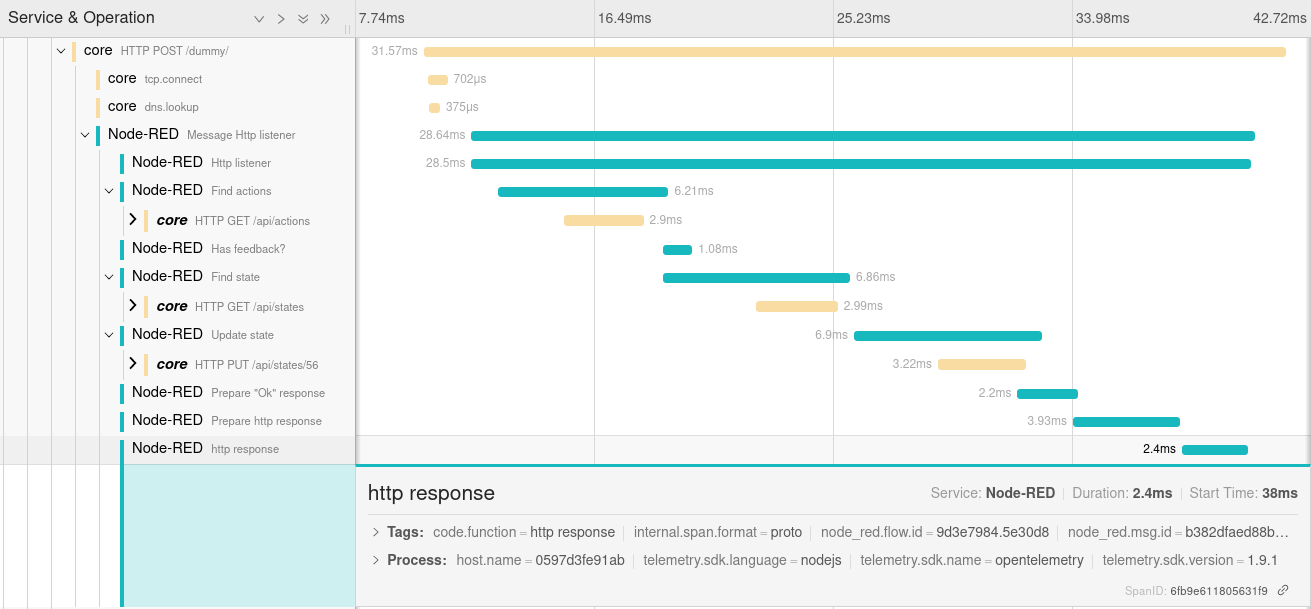
Traces
- based on OpenTelemetry JavaScript framework and Node-RED messaging hooks:
- create spans on
onSend(source)andpostDeliver(destination)events, - end spans on
onCompleteandpostDeliver(source)events.
- create spans on
- trace includes:
- message id,
- flow id,
- node id,
- node type,
- node name (if filled),
- hostname,
- optional
http status code(for request node type), - optional
exception, - optional custom attributes based on message data.


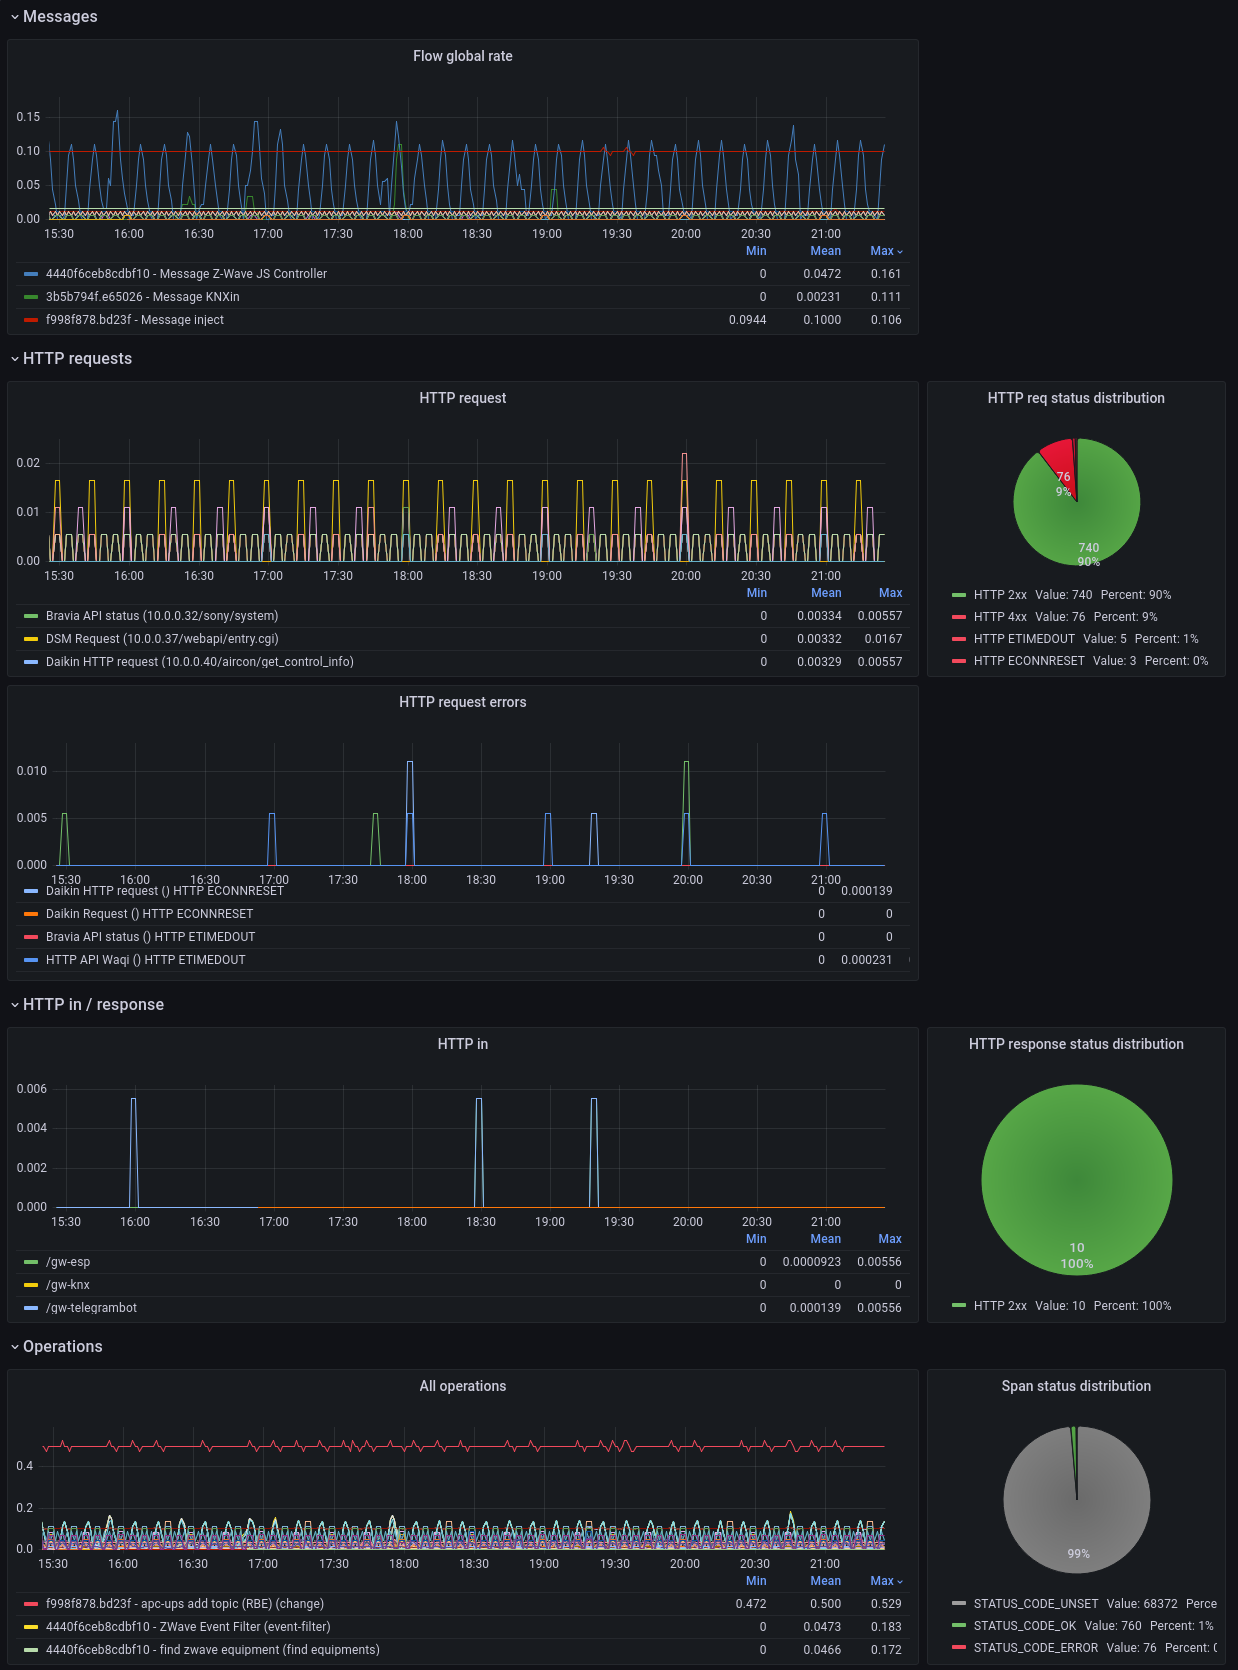
Metrics
- export of request metrics from
http innodes (for Prometheus scraping):- method,
- route,
- status,
- ip
- duration.
curl http://localhost:1881/metrics
# HELP target_info Target metadata
# TYPE target_info gauge
target_info{service_name="Node-RED",telemetry_sdk_language="nodejs",telemetry_sdk_name="opentelemetry",telemetry_sdk_version="1.30.0"} 1
# HELP http_request_duration Response time for incoming http requests in milliseconds
# UNIT http_request_duration ms
# TYPE http_request_duration histogram
http_request_duration_count{method="POST",route="/api/test",status="201",ip="127.0.0.1"} 5
http_request_duration_sum{method="POST",route="/api/test",status="201",ip="127.0.0.1"} 620
http_request_duration_bucket{method="POST",route="/api/test",status="201",ip="127.0.0.1",le="0"} 0
http_request_duration_bucket{method="POST",route="/api/test",status="201",ip="127.0.0.1",le="25"} 0
http_request_duration_bucket{method="POST",route="/api/test",status="201",ip="127.0.0.1",le="50"} 4
http_request_duration_bucket{method="POST",route="/api/test",status="201",ip="127.0.0.1",le="75"} 4
http_request_duration_bucket{method="POST",route="/api/test",status="201",ip="127.0.0.1",le="100"} 4
http_request_duration_bucket{method="POST",route="/api/test",status="201",ip="127.0.0.1",le="250"} 4
http_request_duration_bucket{method="POST",route="/api/test",status="201",ip="127.0.0.1",le="500"} 4
http_request_duration_bucket{method="POST",route="/api/test",status="201",ip="127.0.0.1",le="1000"} 5
http_request_duration_bucket{method="POST",route="/api/test",status="201",ip="127.0.0.1",le="2000"} 5
http_request_duration_bucket{method="POST",route="/api/test",status="201",ip="127.0.0.1",le="+Inf"} 5
Installation
Search node-red-contrib-opentelemetry within the palette manager or install with npm from the command-line (within your user data directory):
npm install node-red-contrib-opentelemetry
As with every node installation, you will need to restart Node-RED for it to pick-up the new nodes.
Usage
Traces
- Add OTEL node once (to any flow),
- Setup the node:
- set OTEL exporter url (example for Jaeger:
http://localhost:4318/v1/traces), - choose an OTLP transport protocol (
http/jsonorhttp/protobuf), - define a service name (will be displayed as span service),
- define an optional root span prefix (will be added in Node-RED root span name),
- define nodes that should not send traces (using comma-separated list like
debug,catch), - define nodes that should propagate W3C trace context (in http request headers, using comma-separated list like
http request,my-custom-node), - define time in seconds after which an unmodified message will be ended and deleted,
- define custom attributes you want to send (optionally).
- set OTEL exporter url (example for Jaeger:
Metrics
- Add Prometheus node once (to any flow),
- Setup the node:
- set Prometheus export port and endpoint (example:
1881and/metrics), - define a service name (will be displayed in export),
- define a instrument name (will be displayed in export),
- set Prometheus export port and endpoint (example:
- Add middleware to your
settings.jsfile:// import the prometheus middleware const { prometheusMiddleware } = require('node-red-contrib-opentelemetry/lib/prometheus-exporter.js') // ... // then add it to the existing httpNodeMiddleware attribute httpNodeMiddleware: prometheusMiddleware, // ...
Versioning
node-red-contrib-opentelemetry is maintained under the semantic versioning guidelines.
See the releases on this repository for changelog.
Contributors
- Nioc - Initial work
- Wodka - AMQP headers and
CompositePropagator(Jaeger, W3C, B3) - Akrpic77 - MQTT v5 context fields
- joshendriks - Protobuf trace-exporter support
See also the full list of contributors to this project.
Direct dependencies
- @opentelemetry (Apache-2.0)
- jmespath (Apache-2.0)
- on-finished (MIT)
License
This project is licensed under the GNU Lesser General Public License v3.0 - see the LICENSE file for details


