node-red-contrib-effekttariff 0.2.7
Node-RED node for capacity tariff peak shaving — Swedish effekttariff and Belgian capaciteitstarief
node-red-contrib-effekttariff
Node-RED node for capacity tariff peak shaving. Supports both Swedish "effekttariff" and the Flemish (Belgium) "capaciteitstarief".
Supported Regions
This node supports two capacity tariff models:
- Sweden (Effekttariff): Hourly measurement, 2-3 highest peaks per month, seasonal (Nov-Mar)
- Flanders, Belgium (Capaciteitstarief): 15-minute measurement, single highest peak per month, 12-month rolling average
Understanding Capacity Tariffs
Sweden (Effekttariff)
In Sweden, your total electricity cost is typically composed of two main parts:
- Energy Cost (Spot Price): The price for the actual electricity (kWh) you consume. With a dynamic contract ("rörligt elpris med timprisavtal"), this price changes every hour based on the Nord Pool spot market.
- Grid Fee (Nätavgift): What you pay to your local grid company (
nätbolag) for grid maintenance and usage.
The Swedish power tariff (effektavgift) is based on the average of your 2-3 highest hourly consumption values during a month. These peaks are often only measured on different weekdays during specific "peak hours" (e.g., 07:00-21:00) and during winter months (November-March).
Flanders, Belgium (Capaciteitstarief)
Starting January 2023, households in Flanders (Belgium) have a capacity tariff based on:
- 15-minute measurement intervals using fixed blocks aligned to clock boundaries (0:00, 0:15, 0:30, 0:45) — not a rolling window
- Single highest peak per month determines monthly capacity
- 12-month rolling average for annual billing
- 24/7 measurement (no peak hours, no seasonal restrictions)
- Cost: ~€50/kW/year based on the rolling average
A single high-power event (like EV charging at 11kW) can significantly impact your annual capacity fee, making peak shaving especially valuable for households in Flanders.
How the Power Tariff Works
The goal of the power tariff is to encourage users to spread out their consumption and reduce load on the grid. It does this by adding a fee based on your highest consumption peaks.
Important: You must configure this node according to your specific grid company's rules, or use the region presets for quick setup.
Disclaimer: The peak reduction estimates provided by this node and its tools are theoretical. Actual savings depend on many factors including your consumption patterns, equipment response times, battery efficiency, and grid conditions. Results may vary from simulated values.
Installation
cd ~/.node-red
npm install node-red-contrib-effekttariff
Then restart Node-RED.
Nodes
effekttariff
The main peak-shaving node. Tracks consumption peaks and outputs an AC input current limit to keep your monthly capacity fee in check. Supports Swedish effekttariff and Flemish capaciteitstarief billing models.
effekttariff-p1
Adapter for smart meters that expose OBIS 1-0:1.4.0 (quarter-hour demand) and 1-0:1.6.0 (monthly peak) on their P1 port — currently Fluvius digital meters in Flanders. Normalises the meter data to Watts and outputs it in the format effekttariff expects, so the node tracks the exact billing value rather than computing its own accumulation.
Wire it as: P1 source (MQTT / ESPHome) → effekttariff-p1 → effekttariff (Belgium preset)
Usage
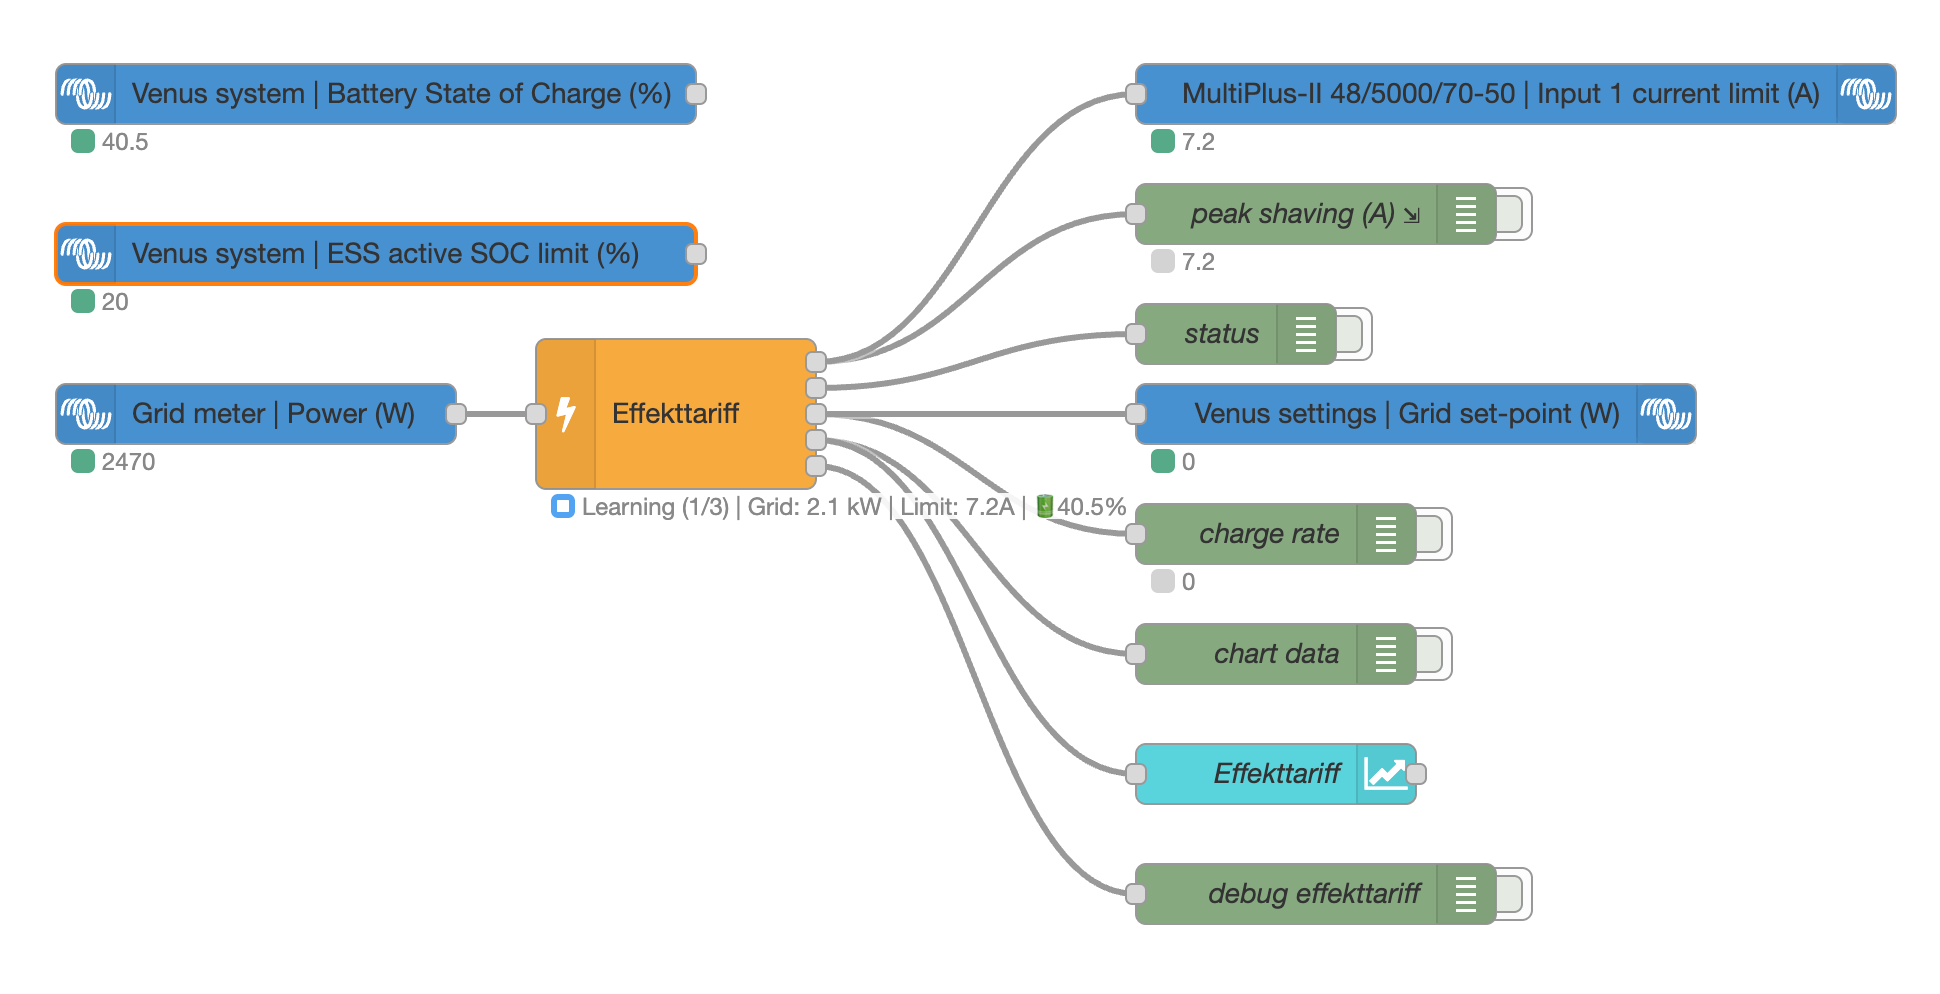
Example integration with Victron Energy: grid meter power feeds into the node; outputs drive the inverter current limit, Venus OS grid set-point, battery charge rate, and a Dashboard 2.0 chart.
Input
Connect a Grid Meter node (Power in Watts) to the input. The node expects positive values for grid import.
Outputs
Current Limit (A): Target current limit in Amperes. Connect to your ESS current limit control (e.g., Victron
Ac/In/1/CurrentLimit). Only outputs when the value changes.Status: Object with detailed peak data for debugging or dashboard display.
Charge Rate (W): Battery charge rate recommendation in Watts (only when battery charging is enabled). Connect to your battery charge controller to ensure the battery is charged before peak hours.
Chart Data: Array of chart-ready messages for Dashboard 1.0 and FlowFuse Dashboard 2.0. Connect to a
ui-chartnode to visualize consumption, limits, and peaks in real-time. Each message has atopic(series name) and a numericpayload(value in Watts or %). Series include:consumption,limit,target,peak_avg,battery_soc.
Configuration
Region Preset
Use the region preset dropdown for quick configuration:
| Region | Description |
|---|---|
| Custom | Manual configuration of all settings |
| Sweden | 60-min intervals, 3 peaks/month, one per day, peak hours 07-21, season Nov-Mar |
| Belgium | 15-min intervals, single peak/month, 24/7 measurement, 12-month rolling average |
Measurement Settings (Belgium/Advanced)
| Setting | Description | Default |
|---|---|---|
| Measurement interval | 15, 30, or 60 minutes | 60 min |
| Single peak per month | Only track highest peak per month (Belgium-style) | No |
| Annual billing | Enable 12-month rolling average (Belgium-style) | No |
| Rolling months | Number of months to average for annual billing | 12 |
Peak Measurement (Sweden)
| Setting | Description | Default |
|---|---|---|
| Peaks to average | Number of top peaks used for monthly average | 3 |
| One peak per day | Only count the highest peak each day | Yes |
| Peak hours | Time window for measurement (e.g., 07:00-21:00) | 07-21 |
| Weekdays only | Skip weekends | No |
| Night discount 50% | Consumption 22:00-06:00 counts at 50% | No |
| Winter season only | Only measure during specified months | Yes |
| Season | Month range (e.g., November-March) | Nov-Mar |
Limits
| Setting | Description | Default |
|---|---|---|
| Minimum (kW) | Floor value, never go below this | 4 kW |
| Headroom (kW) | Buffer below target for reaction time | 0.3 kW |
Electrical
| Setting | Description | Default |
|---|---|---|
| Phases | 1 or 3 phase installation | 3 |
| Grid voltage | Your grid voltage | 230 V |
| Max breaker | Safety cap, never exceed this | 25 A |
| Threshold-based limiting | Only apply current limit when the running average of the current interval reaches the peak threshold. Recommended for three-phase systems with unbalanced loads (capaciteitstarief). | No |
Battery Charging (Optional)
Enable smart battery charging to ensure your battery is charged before peak hours. This allows effective peak shaving by having enough stored energy ready.
| Setting | Description | Default |
|---|---|---|
| Enable battery charging | Activate battery charge control | No |
| SOC context key | Global context key for current SOC (%) | battery.soc |
| Min SOC context key | Global context key for minimum SOC (%) | battery.minSoc |
| Capacity (kWh) | Battery capacity in kWh | 10 kWh |
| Max charge rate (W) | Maximum charge rate in Watts | 3000 W |
| SOC buffer (%) | Target SOC = minSoc + buffer | 20% |
How it works:
- During off-peak hours, the node calculates how much time remains until peak hours
- It determines the energy needed to reach target SOC (minSoc + buffer)
- Outputs a charge rate that ensures the battery is ready before peaks
- During peak hours, charge rate is 0 (battery should be available for discharge)
Integration:
- Set up a battery monitoring node to store SOC in global context
- Configure the context keys to match your setup
- Connect the third output (Charge Rate) to your battery charge controller
Status Indicator
- Grey ring: Off-season
- Green ring: Off-peak hours
- Blue ring: Learning phase (tracking but using minimum limit)
- Blue dot: Peak hours, usage well below target
- Yellow dot: Peak hours, approaching target (>85%)
- Red dot: Peak hours, over target (>105%)
Learning Phase
At the start of each month (or first use), the node enters a learning phase until it has recorded enough peaks. During learning, it outputs the minimum limit to prevent establishing unnecessarily high peaks.
Watts to Amps Conversion
- 1-phase: Amps = Watts / Voltage
- 3-phase: Amps = Watts / (3 × Voltage)
Example at 230V: 4 kW = 17.4A (1-phase) or 5.8A (3-phase)
Provider Examples
Sweden
| Provider | Peaks | Hours | Season | Night | Weekdays |
|---|---|---|---|---|---|
| Ellevio | 3 | 07-19 | Nov-Mar | No | Yes |
| Kungälv Energi | 3 | 07-21 | Nov-Mar | Yes | Yes |
| Jönköping Energi | 2 | 07-21 | All year | No | No |
Belgium (Flanders)
| Setting | Value |
|---|---|
| Measurement interval | 15 minutes |
| Peak tracking | Single highest per month |
| Billing period | 12-month rolling average |
| Peak hours | 24/7 (no restrictions) |
| Season | All year |
Quick Setup: Select "Belgium" from the Region dropdown to auto-configure all settings.
Future Development
This node is under active development. Future enhancements will focus on creating a more comprehensive "Cost-Saving Optimizer" by integrating dynamic spot prices.
- Flexible Tariff Models: Allow users to select their grid company's specific power tariff model (
average of N peaksvs.single highest peak). - Cost-Aware Logic: Make the battery charging and discharging logic aware of the hourly energy price. The system will then be able to make economic decisions, balancing the cost of the power tariff against the cost of the energy itself.
Battery Sizing Tool
An interactive web-based tool is available to help you understand how a battery can reduce your effekttariff peaks. The tool simulates different battery configurations and consumption profiles to estimate potential savings.
Try the Battery Sizing Tool (English/Swedish)
Features:
- Adjust battery capacity, charge rates, and SOC settings
- Choose from predefined consumption profiles (typical household, EV charging, heat pump)
- Configure your grid provider's peak hours and peak count
- Set your electrical installation (phases, breaker size)
- View simulated peak reduction with interactive charts
Note: The simulation results are theoretical estimates based on simplified consumption patterns. Actual savings depend on your real consumption behavior, battery efficiency, grid conditions, and other factors. Use the tool for guidance and planning purposes only.
Simulation & Testing
The package includes a simulation framework for testing and validating system behavior without connecting to real hardware.
Running Simulations
# List all available scenarios
npm run simulate

# Run a specific scenario
npm run simulate:scenario basicWeek

# Run all scenarios
npm run simulate:all

# Run with verbose output
npm run simulate:verbose basicWeek

# Generate HTML report with interactive charts
node scripts/run-simulation.js basicWeek --html

# Export data to CSV files
node scripts/run-simulation.js basicWeek --csv

# Generate both HTML and CSV
node scripts/run-simulation.js basicWeek --html --csv
Visualization Options
The simulation CLI supports two visualization modes:
HTML Report (--html): Generates an interactive HTML report with Chart.js charts showing:
- Hourly power consumption vs limit (line chart)
- Top recorded peaks (horizontal bar chart)
- Battery SOC over time (if applicable)
- Battery charge rate (if applicable)
The HTML file auto-opens in your default browser.
CSV Export (--csv): Exports simulation data to CSV files:
*_hourly.csv- Hourly consumption data*_peaks.csv- Peak records with timestamps*_limits.csv- Limit changes over time*_battery.csv- Battery data (if applicable)
Output files are saved to ./simulation-output/.
Available Scenarios
Interactive HTML reports are automatically generated and available online. View all simulation reports
| Scenario | Description | Duration | Report |
|---|---|---|---|
basicWeek |
Typical Swedish household consumption | 7 days | View |
fullMonth |
Complete month to verify peak reset | 35 days | View |
highSpikes |
Baseline with EV charging/sauna spikes | 14 days | View |
nightDiscount |
Tests night discount (nattsänkning) feature | 7 days | View |
weekdaysOnly |
Weekday-only limit enforcement (Ellevio style) | 14 days | View |
winterSeason |
Winter season filtering (Nov-Mar) | 60 days | View |
singlePhase |
Single phase installation | 7 days | View |
minimumLimit |
Very low consumption, minimum limit test | 7 days | View |
jonkoping |
Jönköping Energi configuration (2 peaks) | 14 days | View |
stressTest |
High variability consumption | 30 days | View |
batteryCharging |
Smart battery charging during off-peak | 7 days | View |
batteryBalancing |
Periodic battery balancing feature | 1 day | View |
dynamicHeadroom |
Dynamic headroom based on battery SOC | 1 day | View |
downtimeDetection |
System downtime detection with data gaps | 3 days | View |
belgiumBasic |
Belgian capacity tariff with 15-min intervals | 30 days | View |
belgiumWithEV |
Belgian household with 11kW EV charging | 30 days | View |
belgiumAnnualRolling |
Full year showing 12-month rolling average | 395 days | View |
belgiumThreephase |
Three-phase unbalanced loads with threshold limiting | 30 days | View |
Running Tests
# Run all tests
npm test

# Run with coverage
npm run test:coverage

# Run in watch mode during development
npm run test:watch
License
MIT
Author
Dirk-Jan Faber test