@theotherwillembotha/node-red-prometheus 0.4.6
Prometheus metrics provider plugin for node-red-plugincore.
@theotherwillembotha/node-red-prometheus
Prometheus metrics provider for Node-RED. Built on @theotherwillembotha/node-red-plugincore (bundled — no separate install required).
Provides:
- Prometheus Metrics Config - a metrics provider config node that exposes a Prometheus-compatible scrape endpoint via the Webhook system
- Counter, Gauge, Histogram, Summary metric types - available to any node using the plugincore
@Metricsdecorator
Installation
Either use the Manage Palette option in the Node-RED editor, or run the following command in your Node-RED user directory (typically ~/.node-red):
npm install @theotherwillembotha/node-red-prometheus
Nodes
Prometheus Metrics Config
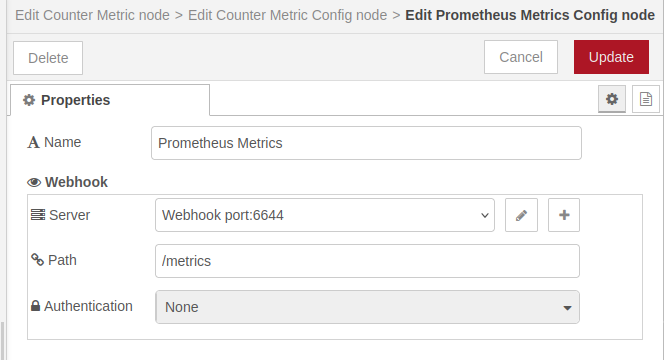
A config node that acts as the Prometheus metrics provider for the plugincore @Metrics system. Once configured, it appears in the metrics selector dropdown of any node built with the @Metrics decorator.
| Field | Description |
|---|---|
| Name | Display label for this config node |
| Webhook Path | The HTTP path Prometheus will scrape (configured via the Webhook section) |
| Webhook Port | The port the scrape endpoint listens on (configured via the Webhook section) |
The scrape endpoint responds to GET requests with metrics in the standard Prometheus exposition format, using the content type from prom-client.
Metric Types
All metric types are created automatically when a node declares them via the @Metrics decorator. The following types are supported:
Counter
A monotonically increasing value (e.g. total requests processed).
@Metrics({ name: "requests_total", type: MetricType.Counter, description: "Total requests" })
private requests!: CounterMetric;

// usage
this.requests.inc();
Gauge
A value that can go up and down (e.g. current queue depth).
@Metrics({ name: "queue_depth", type: MetricType.Gauge, description: "Current queue depth" })
private queueDepth!: GaugeMetric;

// usage
this.queueDepth.inc();
this.queueDepth.dec();
this.queueDepth.set(42);
Histogram
Records observations into configurable buckets (e.g. request duration). Supports manual, linear, and exponential bucket configurations.
@Metrics({ name: "duration_seconds", type: MetricType.Histogram, description: "Request duration" })
private duration!: HistogramMetric;

// usage
this.duration.observe(0.25);
Summary
Records observations and calculates configurable percentiles (defaults: 0.01, 0.1, 0.9, 0.99).
@Metrics({ name: "response_size", type: MetricType.Summary, description: "Response size" })
private responseSize!: SummaryMetric;

// usage
this.responseSize.observe(1024);
Prerequisites
- Node.js 18+
- Node-RED 4+
- A Prometheus server configured to scrape the endpoint
Repository
- Source: github.com/theotherwillembotha/nodered_prometheus
- Issues: github.com/theotherwillembotha/nodered_prometheus/issues