Embed Grafana Chart in NR dashboard
With this example you can embed your Grafana charts in the Node-red dashboard.
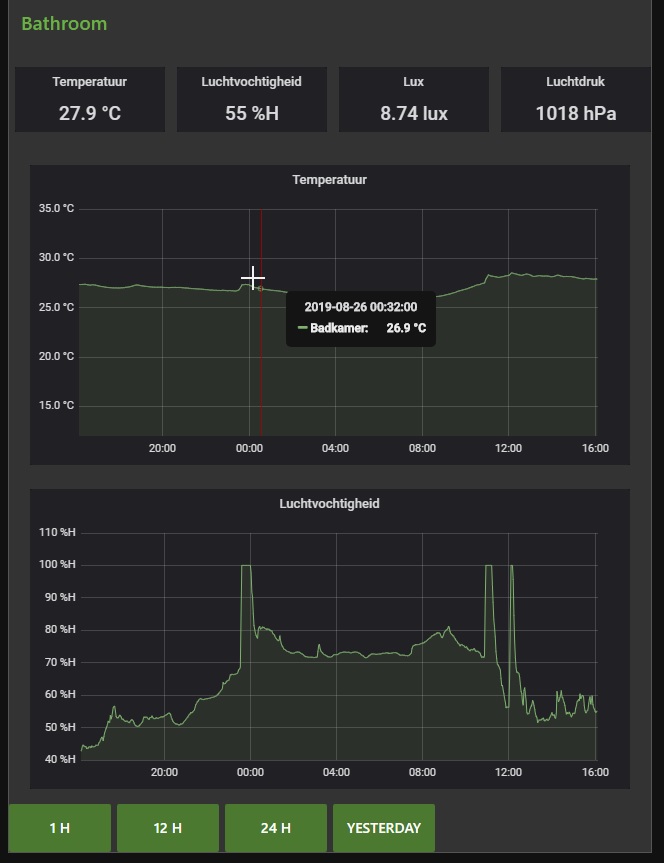
In this example there are charts and Singlestat panels to will show the current value. For the chart you can choose with the help of a button 1, 12 or 24 Hour view or the data from yesterday. Of course you can change this requiring your needs. Even the zoom with this mouse will work.
You need a up and running database and Grafana. Made this example with Grafana 6.3.2.
Note: When deploying the node-red flow the browser will not always show the charts, please press F5 to refresh the browser.
To get it working you need to change some settings in the grafana.ini file. Change anonymous access enabled = true and allow_embedding=true. If you can't find the last one, add it to the section [security]
To get it working, choose a already working chart that you have in your Grafana setup. We have to copy some settings to the Buildtemplate node. Click on the triangle and choose share and then the tab embed. Copy from the share url the part starting with http:... and ends with orgid=1, for example http://192.168.1.127:3000/d-solo/0032x0mgk/joshuadashboard?orgId=1 also take a note at the panelid and write down this number. Copy the url now in NR in the Buildtemplate fucntion. It's simple replacing the url that's there. Change also the panelid on the first line.
If you want to see the Grafana panel that I used or have a peak at some settings, have a look a this:
This is the Json code for the "Temperatuur" chart. You can import in Grafana by clicking in your chart on more, panel json. Remove the existing code and past this in there.
Update 23/4/2020 In some rare cases the chart disappeared after a page refresh or change tab in the browser. Updated the Node-red flow below and this problem should be fixed now. Moved some stuff from the Buildtemplate function node to the template node to fix this.
[
{
  "aliasColors": {},
  "bars": false,
  "dashLength": 10,
  "dashes": false,
  "datasource": "JoshuaSensors",
  "decimals": 1,
  "fill": 1,
  "fillGradient": 0,
  "gridPos": {
    "h": 7,
    "w": 12,
    "x": 0,
    "y": 0
  },
  "id": 2,
  "legend": {
    "alignAsTable": true,
    "avg": false,
    "current": true,
    "max": true,
    "min": true,
    "rightSide": true,
    "show": false,
    "total": false,
    "values": true
  },
  "lines": true,
  "linewidth": 1,
  "links": [],
  "nullPointMode": "null",
  "options": {
    "dataLinks": []
  },
  "percentage": false,
  "pointradius": 0.5,
  "points": false,
  "renderer": "flot",
  "seriesOverrides": [],
  "spaceLength": 10,
  "stack": false,
  "steppedLine": false,
  "targets": [
    {
      "alias": "Badkamer",
      "groupBy": [
        {
          "params": [
            "2m"
          ],
          "type": "time"
        },
        {
          "params": [
            "null"
          ],
          "type": "fill"
        }
      ],
      "measurement": "Badkamer_109_temperatuur",
      "orderByTime": "ASC",
      "policy": "default",
      "query": "SELECT mean(\"value\") FROM \"Badkamer_109_temperatuur\" WHERE $timeFilter GROUP BY time(2m) fill(null)",
      "rawQuery": true,
      "refId": "C",
      "resultFormat": "time_series",
      "select": [
        [
          {
            "params": [
              "value"
            ],
            "type": "field"
          },
          {
            "params": [],
            "type": "mean"
          }
        ]
      ],
      "tags": []
    }
  ],
  "thresholds": [],
  "timeFrom": null,
  "timeRegions": [],
  "timeShift": null,
  "title": "Temperatuur",
  "tooltip": {
    "shared": true,
    "sort": 0,
    "value_type": "individual"
  },
  "type": "graph",
  "xaxis": {
    "buckets": null,
    "mode": "time",
    "name": null,
    "show": true,
    "values": []
  },
  "yaxes": [
    {
      "decimals": 1,
      "format": "celsius",
      "label": null,
      "logBase": 1,
      "max": "35",
      "min": "12",
      "show": true
    },
    {
      "format": "short",
      "label": null,
      "logBase": 1,
      "max": null,
      "min": null,
      "show": true
    }
  ],
  "yaxis": {
    "align": false,
    "alignLevel": null
  }
}] ```

And this is the panel json code for the singlestat.
Because we want in this panel only the last value (is the most current) from the database, I have made a query that can only be change from the Query text edit mode.

```[ {
  "cacheTimeout": null,
  "colorBackground": false,
  "colorPostfix": false,
  "colorValue": false,
  "colors": [
    "#299c46",
    "rgba(237, 129, 40, 0.89)",
    "#d44a3a"
  ],
  "decimals": 1,
  "format": "celsius",
  "gauge": {
    "maxValue": 100,
    "minValue": 0,
    "show": false,
    "thresholdLabels": false,
    "thresholdMarkers": true
  },
  "gridPos": {
    "h": 2,
    "w": 2,
    "x": 12,
    "y": 0
  },
  "id": 4,
  "interval": null,
  "links": [],
  "mappingType": 1,
  "mappingTypes": [
    {
      "name": "value to text",
      "value": 1
    },
    {
      "name": "range to text",
      "value": 2
    }
  ],
  "maxDataPoints": 100,
  "nullPointMode": "connected",
  "nullText": null,
  "options": {},
  "postfix": "",
  "postfixFontSize": "50%",
  "prefix": "",
  "prefixFontSize": "50%",
  "rangeMaps": [
    {
      "from": "null",
      "text": "N/A",
      "to": "null"
    }
  ],
  "sparkline": {
    "fillColor": "rgba(31, 118, 189, 0.18)",
    "full": false,
    "lineColor": "rgb(31, 120, 193)",
    "show": false,
    "ymax": null,
    "ymin": null
  },
  "tableColumn": "last",
  "targets": [
    {
      "alias": "Test",
      "groupBy": [],
      "limit": "1",
      "measurement": "Omgevingssensormeterkast_124",
      "orderByTime": "DESC",
      "policy": "default",
      "query": "SELECT last(\"value\") FROM \"Badkamer_109_temperatuur\" WHERE time > 0 ORDER BY time DESC LIMIT 1",
      "rawQuery": true,
      "refId": "A",
      "resultFormat": "time_series",
      "select": [
        [
          {
            "params": [
              "humidity"
            ],
            "type": "field"
          },
          {
            "params": [],
            "type": "last"
          }
        ]
      ],
      "tags": []
    }
  ],
  "thresholds": "",
  "timeFrom": null,
  "timeShift": null,
  "title": "Temperatuur",
  "type": "singlestat",
  "valueFontSize": "50%",
  "valueMaps": [
    {
      "op": "=",
      "text": "N/A",
      "value": "null"
    }
  ],
  "valueName": "current"
} ]```

The Node_red flow:
[{"id":"a81b68f.57a7498","type":"ui_template","z":"1afdf66f.4f98b2","group":"bbc3532f.41ca7","name":"Temperature","order":1,"width":"3","height":"2","format":"<iframe style=\"\n width:150px; \n height:65px;\n overflow: hidden;\n margin: auto;\n border: 0px solid green;\n \"\nframeborder=\"0\" scrolling=\"no\" marginheight=\"0\" marginwidth=\"0\"\n\nsrc=\"http://192.168.1.127:3000/d-solo/0032x0mgk/joshuadashboard?orgId=1&refresh=1m&panelId=4\" \n \n \n></iframe>\n\n","storeOutMessages":true,"fwdInMessages":true,"templateScope":"local","x":1090,"y":400,"wires":[[]]},{"id":"71a9ded5.a7056","type":"ui_template","z":"1afdf66f.4f98b2","group":"bbc3532f.41ca7","name":"Humidity","order":2,"width":"3","height":"2","format":"<iframe style=\"\n width:150px; \n height:65px;\n overflow: hidden;\n margin: auto;\n border: 0px solid green;\n \"\nframeborder=\"0\" scrolling=\"no\" marginheight=\"0\" marginwidth=\"0\"\n\nsrc=\"http://192.168.1.127:3000/d-solo/0032x0mgk/joshuadashboard?orgId=1&refresh=1m&panelId=7\" \n \n \n></iframe>\n\n","storeOutMessages":true,"fwdInMessages":true,"templateScope":"local","x":1080,"y":440,"wires":[[]]},{"id":"ac6a62b5.39975","type":"ui_button","z":"1afdf66f.4f98b2","name":"","group":"bbc3532f.41ca7","order":10,"width":"2","height":"1","passthru":true,"label":"24 H","tooltip":"","color":"","bgcolor":"","icon":"","payload":"24","payloadType":"num","topic":"","x":390,"y":280,"wires":[["de8150aa.71733"]]},{"id":"2352d27e.94005e","type":"ui_button","z":"1afdf66f.4f98b2","name":"","group":"bbc3532f.41ca7","order":9,"width":"2","height":"1","passthru":false,"label":"12 H","tooltip":"","color":"","bgcolor":"","icon":"","payload":"12","payloadType":"num","topic":"","x":390,"y":320,"wires":[["de8150aa.71733"]]},{"id":"5bf0d866.9868c","type":"ui_button","z":"1afdf66f.4f98b2","name":"","group":"bbc3532f.41ca7","order":8,"width":"2","height":"1","passthru":false,"label":"1 H","tooltip":"","color":"","bgcolor":"","icon":"","payload":"1","payloadType":"num","topic":"","x":390,"y":240,"wires":[["de8150aa.71733"]]},{"id":"de8150aa.71733","type":"function","z":"1afdf66f.4f98b2","name":"SetTimeRange","func":"var p_30d = 1000*60*60*24*30 ; //30 Days\nvar p_7d = 1000*60*60*24*7 ; //7 Days\nvar p_1d = 1000*60*60*24 ; // 1 Day\nvar p_hr = 1000*60*60; //1 Hour\n\nvar d = new Date();\nvar current = d.getTime();\n\n\nmsg.fromdate = \"now-\" + msg.payload +\"h\";\nmsg.enddate = \"now\";\n\n\nreturn msg;","outputs":1,"noerr":0,"x":620,"y":280,"wires":[["aeaaadf4.7dcb","9d22cca6.a6c168"]]},{"id":"383e32a3.06bd66","type":"function","z":"1afdf66f.4f98b2","name":"SetTimeYesterday","func":"var p_30d = 1000*60*60*24*30 ; //30 Days\nvar p_7d = 1000*60*60*24*7 ; //7 Days\nvar p_1d = 1000*60*60*24 ; // 1 Day\nvar p_hr = 1000*60*60; //1 Hour\n\nvar d = new Date();\nvar current = d.getTime();\nvar today0h = d.setHours(0,0,0,0); //Timestamp midnight\n\nmsg.fromdate = today0h - p_1d\nmsg.enddate = today0h\nreturn msg;","outputs":1,"noerr":0,"x":610,"y":320,"wires":[["aeaaadf4.7dcb","9d22cca6.a6c168"]]},{"id":"45bedb8.0b380a4","type":"ui_button","z":"1afdf66f.4f98b2","name":"","group":"bbc3532f.41ca7","order":11,"width":"2","height":"1","passthru":false,"label":"Yesterday","tooltip":"","color":"","bgcolor":"","icon":"","payload":"yesterday","payloadType":"str","topic":"","x":380,"y":360,"wires":[["383e32a3.06bd66"]]},{"id":"7adc3ee7.b03f6","type":"ui_template","z":"1afdf66f.4f98b2","group":"bbc3532f.41ca7","name":"Page Got Loaded","order":6,"width":0,"height":0,"format":"<script>\n(function() {\n (function(scope) {\n scope.send({payload: \"preload\"}); // this gets sent when the view is opened in the browser\n })(scope);\n})();\n</script>","storeOutMessages":false,"fwdInMessages":false,"templateScope":"local","x":190,"y":280,"wires":[["ac6a62b5.39975"]]},{"id":"4ef73409.86b684","type":"ui_template","z":"1afdf66f.4f98b2","group":"bbc3532f.41ca7","name":"Lux","order":3,"width":"3","height":"2","format":"<iframe style=\"\n width:150px; \n height:65px;\n overflow: hidden;\n margin: auto;\n border: 0px solid green;\n \"\nframeborder=\"0\" scrolling=\"no\" marginheight=\"0\" marginwidth=\"0\"\n\nsrc=\"http://192.168.1.127:3000/d-solo/0032x0mgk/joshuadashboard?orgId=1&refresh=1m&panelId=8\" \n \n \n></iframe>\n\n","storeOutMessages":true,"fwdInMessages":true,"templateScope":"local","x":1070,"y":480,"wires":[[]]},{"id":"85217b62.298bb8","type":"ui_template","z":"1afdf66f.4f98b2","group":"bbc3532f.41ca7","name":"Airpressure","order":4,"width":"3","height":"2","format":"<iframe style=\"\n width:150px; \n height:65px;\n overflow: hidden;\n margin: auto;\n border: 0px solid green;\n \"\nframeborder=\"0\" scrolling=\"no\" marginheight=\"0\" marginwidth=\"0\"\n\nsrc=\"http://192.168.1.127:3000/d-solo/0032x0mgk/joshuadashboard?orgId=1&refresh=1m&panelId=11\" \n \n \n></iframe>\n\n","storeOutMessages":true,"fwdInMessages":true,"templateScope":"local","x":1090,"y":520,"wires":[[]]},{"id":"14f5cd67.1fbd6b","type":"ui_template","z":"1afdf66f.4f98b2","group":"bbc3532f.41ca7","name":"Charttemperatuur","order":5,"width":0,"height":0,"format":"<html>\n<iframe id=\"myFrame\" width=\"600px\" height=\"300px\" style = \"overflow:hidden; margin:auto; border:0px solid green;\"></iframe>\n\n<script>\n//NOTE, more then one chart on a page, rename in the second and following \n//templates the \"myframe\" variable so that every template has a unique name.\n(function(scope) {\n // watch msg object from Node-RED\n scope.$watch('msg', function(msg) {\n // new message received\n var x = document.getElementById('myFrame');\n x.setAttribute('src', msg.payload); \n });\n})(scope);\n</script>\n</html>","storeOutMessages":true,"fwdInMessages":true,"templateScope":"local","x":1110,"y":280,"wires":[[]]},{"id":"aeaaadf4.7dcb","type":"function","z":"1afdf66f.4f98b2","name":"BuildTemplate","func":"//NOTE, more then one chart on a page, rename in the second and following \n//templates the \"myframe\" variable so that every template has a unique name.\n\npanelid=2\n\nmsg.payload= \"http://192.168.1.127:3000/d-solo/0032x0mgk/joshuadashboard-badkamer?orgId=1\"+\n\"&refresh=1m\"+\n\"&theme=dark\"+\n\"&from=\"+ msg.fromdate +\n\"&to=\"+ msg.enddate +\n\"&panelId=\"+panelid\n\nreturn msg;\n\n","outputs":1,"noerr":0,"x":840,"y":280,"wires":[["14f5cd67.1fbd6b"]]},{"id":"4769fee0.9701d8","type":"ui_template","z":"1afdf66f.4f98b2","group":"bbc3532f.41ca7","name":"Chartluchtvochtigheid","order":6,"width":0,"height":0,"format":"<html>\n<iframe id=\"myFrame2\" width=\"600px\" height=\"300px\" style = \"overflow:hidden; margin:auto; border:0px solid green;\"></iframe>\n\n<script>\n//NOTE, more then one chart on a page, rename in the second and following \n//templates the \"myframe\" variable so that every template has a unique name.\n(function(scope) {\n // watch msg object from Node-RED\n scope.$watch('msg', function(msg) {\n // new message received\n var x = document.getElementById('myFrame2');\n x.setAttribute('src', msg.payload); \n });\n})(scope);\n</script>\n</html>","storeOutMessages":true,"fwdInMessages":true,"templateScope":"local","x":1120,"y":320,"wires":[[]]},{"id":"9d22cca6.a6c168","type":"function","z":"1afdf66f.4f98b2","name":"BuildTemplate","func":"//NOTE, more then one chart on a page, rename in the second and following \n//templates the \"myframe\" variable so that every template has a unique name.\n\npanelid=9\n\nmsg.payload= \"http://192.168.1.127:3000/d-solo/0032x0mgk/joshuadashboard-badkamer?orgId=1\"+\n\"&refresh=1m\"+\n\"&theme=dark\"+\n\"&from=\"+ msg.fromdate +\n\"&to=\"+ msg.enddate +\n\"&panelId=\"+panelid\n\nreturn msg;\n","outputs":1,"noerr":0,"x":840,"y":320,"wires":[["4769fee0.9701d8"]]},{"id":"a4654193.3b49e8","type":"function","z":"1afdf66f.4f98b2","name":"SetTimeTodaySofar","func":"msg.fromdate = \"now/d\";\nmsg.enddate = \"now\";\nreturn msg;","outputs":1,"noerr":0,"x":610,"y":400,"wires":[["aeaaadf4.7dcb","9d22cca6.a6c168"]]},{"id":"556d9df.cb16f64","type":"ui_button","z":"1afdf66f.4f98b2","name":"","group":"bbc3532f.41ca7","order":11,"width":"2","height":"1","passthru":false,"label":"Today","tooltip":"","color":"","bgcolor":"","icon":"","payload":"yesterday","payloadType":"str","topic":"","x":390,"y":400,"wires":[["a4654193.3b49e8"]]},{"id":"bbc3532f.41ca7","type":"ui_group","z":"","name":"Bathroom","tab":"1ff97cd4.681d5b","order":1,"disp":true,"width":"12","collapse":false},{"id":"1ff97cd4.681d5b","type":"ui_tab","z":"","name":"GrafanaTest","icon":"dashboard","order":37}]