@d5mi/node-red-contrib-object-detection-chart-flow
Data Modeling
Pre-requisites
- node-red-contrib-mongodb4
- node-red-dashboard
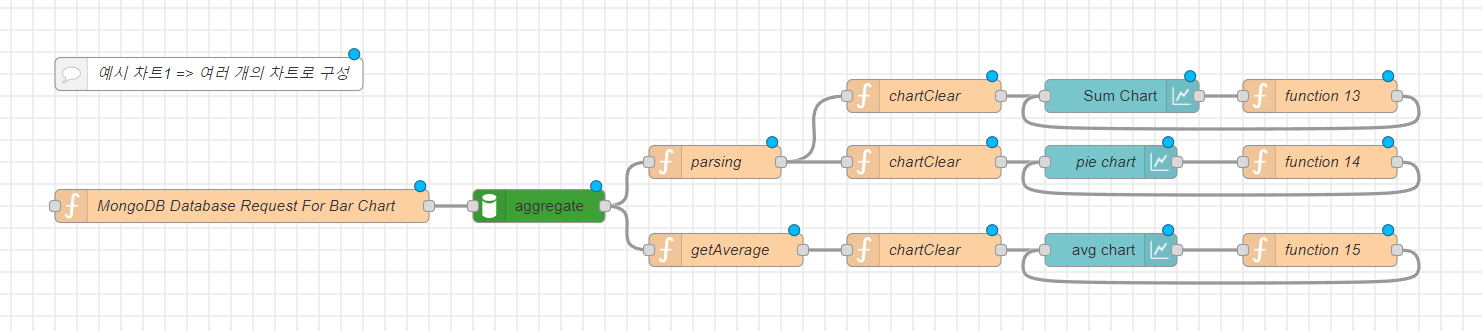
This flow draws a chart using the data stored by the object-detection node.
Enter start date and end date

Sum Chart
The values staying at the location within the period are displayed in the form of a bar chart.

Pie Chart
The values staying at the location within the period are displayed in the form of a pie chart.

Avg Chart
By averaging the values staying at the location within the period, the time spent at the location per day is displayed in the form of a bar chart.

input data format
{ "label": "label"
, "payload": "data value"}
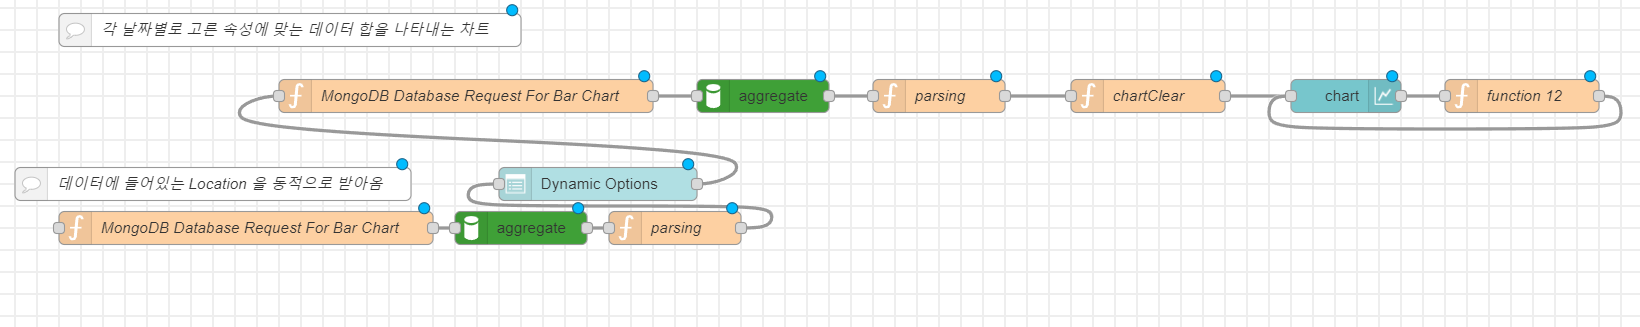
Day Chart
The values staying at the location within the period are divided by date and displayed in the form of a bar chart.

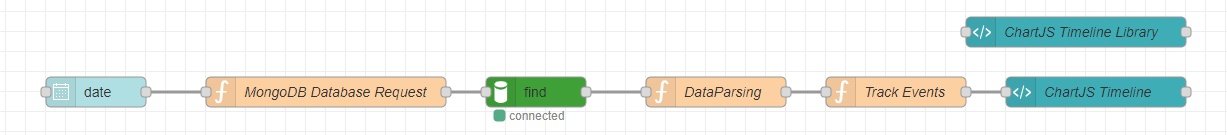
Timeline Chart(Day)
The log value stored on the specified day is displayed as a timeline graph.

input data format(Timeline chart)
{"labels":["Bed","Couch"],"datasets":[{"label":"Bed","timestamp":"2022-09-27T14:29:26.395Z","data":[["2022-11-06T18:02:00.000Z","2022-11-06T18:22:00.000Z","#FF6633"],["2022-11-06T18:42:00.000Z","2022-11-06T19:01:00.000Z","#FF6633"]]},{"label":"Couch","timestamp":"2022-09-27T14:29:26.395Z","data":[["2022-11-06T18:22:00.000Z","2022-11-06T18:42:00.000Z","#5DA5DA"]]}]}
{
	"label": "label",
	"datasets": {"label": "label",
		     "timestamp": "timestamp",
		     "data": ["StartTime", "EndTime", "Color"]
		    }
}
[{"id":"f4861000a83bf631","type":"ui_ui_control","z":"d891a7b10eae2add","name":"","events":"all","x":680,"y":1140,"wires":[[]]},{"id":"fda6a3657c14f683","type":"ui_date_picker","z":"d891a7b10eae2add","name":"","label":"Start Date","group":"a382a4b001eba5ca","order":1,"width":6,"height":2,"passthru":true,"topic":"payload","topicType":"msg","className":"","x":360,"y":1340,"wires":[["4509296a53debfe3"]]},{"id":"4509296a53debfe3","type":"change","z":"d891a7b10eae2add","name":"","rules":[{"t":"set","p":"startDate","pt":"flow","to":"$moment($$.payload).format(\"YYYY-MM-DD\")","tot":"jsonata"}],"action":"","property":"","from":"","to":"","reg":false,"x":530,"y":1340,"wires":[[]]},{"id":"07f53bdc86e78c2b","type":"ui_date_picker","z":"d891a7b10eae2add","name":"","label":"End Date","group":"a382a4b001eba5ca","order":2,"width":6,"height":2,"passthru":true,"topic":"payload","topicType":"msg","className":"","x":360,"y":1400,"wires":[["b04a7efc855d5e5a"]]},{"id":"b04a7efc855d5e5a","type":"change","z":"d891a7b10eae2add","name":"","rules":[{"t":"set","p":"endDate","pt":"flow","to":"$moment($$.payload).format(\"YYYY-MM-DD\")","tot":"jsonata"}],"action":"","property":"","from":"","to":"","reg":false,"x":530,"y":1400,"wires":[[]]},{"id":"1134f9c88a72a8d9","type":"function","z":"d891a7b10eae2add","name":"MongoDB Database Request For Bar Chart","func":"if (msg.topic == \"download\" || msg.topic == \"query\") {\n\n var startDate = flow.get(\"startDate\") || false;\n\n var endDate = flow.get(\"endDate\") || false;\n\n // check if date range is correct\n if (startDate && endDate &&\n new Date(endDate) >= new Date(startDate)) {\n msg.payload = [\n [{ $match: { \"timestamp\": { $gte: new Date(startDate), $lte: new Date(endDate) } } },\n { $group: { \"_id\": \"$location\", payload: { $sum: 1 } } }]\n ];\n return msg;\n } else {\n node.warn(\"end date is before start date. or context not set\");\n }\n\n}","outputs":1,"noerr":0,"initialize":"","finalize":"","libs":[],"x":610,"y":2080,"wires":[["e7a5008d4effd15b"]]},{"id":"e7a5008d4effd15b","type":"mongodb4","z":"d891a7b10eae2add","clientNode":"e4c17237ec481b9e","collection":"test2","operation":"aggregate","output":"toArray","name":"","x":860,"y":2140,"wires":[["945c3a7a8d039e3f","7cb9db4f5468f455"]]},{"id":"46ec7f82d017c103","type":"ui_text_input","z":"d891a7b10eae2add","name":"","label":"Start Time","tooltip":"","group":"a382a4b001eba5ca","order":3,"width":4,"height":2,"passthru":false,"mode":"time","delay":"0","topic":"payload","sendOnBlur":true,"className":"","topicType":"msg","x":810,"y":1500,"wires":[["b011c21ad117e525"]]},{"id":"5c78653dad4487cc","type":"ui_text_input","z":"d891a7b10eae2add","name":"","label":"End Time","tooltip":"","group":"a382a4b001eba5ca","order":7,"width":4,"height":2,"passthru":false,"mode":"time","delay":"0","topic":"payload","sendOnBlur":true,"className":"","topicType":"msg","x":800,"y":1640,"wires":[["10a0d7735f2d67f7"]]},{"id":"10a0d7735f2d67f7","type":"change","z":"d891a7b10eae2add","name":"","rules":[{"t":"set","p":"endTime","pt":"flow","to":"$moment($$.payload).format(\"HH:mm:ss\")","tot":"jsonata"}],"action":"","property":"","from":"","to":"","reg":false,"x":970,"y":1640,"wires":[["2440146819b7261e"]]},{"id":"abc18e6f3296419e","type":"function","z":"d891a7b10eae2add","name":"startDateAddTime","func":"var startTime = flow.get(\"startTime\") || false;\nvar startDate = flow.get(\"startDate\") || false;\nvar timeSplit = startTime.split(\":\");\n\nstartDate = new Date(startDate);\n\nstartDate.setHours(timeSplit[0]);\nstartDate.setMinutes(timeSplit[1]);\n\nstartDate = startDate.getTime();\n\nmsg.payload = startDate;\nflow.set(\"startDate\",startDate);\nreturn msg;\n\n\n\n\n","outputs":1,"noerr":0,"initialize":"","finalize":"","libs":[],"x":1250,"y":1500,"wires":[[]]},{"id":"2440146819b7261e","type":"function","z":"d891a7b10eae2add","name":"endDateAddTime","func":"var endTime = flow.get(\"endTime\") || false;\nvar endDate = flow.get(\"endDate\") || false;\nvar timeSplit = endTime.split(\":\");\n\nendDate = new Date(endDate);\n\nendDate.setHours(timeSplit[0]);\nendDate.setMinutes(timeSplit[1]);\n\nendDate = endDate.getTime();\n\nmsg.payload = endDate;\nflow.set(\"endDate\", endDate);\nreturn msg;\n\n\n\n\n","outputs":1,"noerr":0,"initialize":"","finalize":"","libs":[],"x":1190,"y":1640,"wires":[[]]},{"id":"25aad2dc95503f3e","type":"ui_button","z":"d891a7b10eae2add","name":"","group":"a382a4b001eba5ca","order":9,"width":1,"height":1,"passthru":false,"label":"","tooltip":"","color":"","bgcolor":"","className":"","icon":"refresh","payload":"0","payloadType":"str","topic":"payload","topicType":"msg","x":350,"y":1640,"wires":[["a8fdd74bdb3e9ef4"]]},{"id":"b011c21ad117e525","type":"change","z":"d891a7b10eae2add","name":"","rules":[{"t":"set","p":"startTime","pt":"flow","to":"$moment($$.payload).format(\"HH:mm:ss\")","tot":"jsonata"}],"action":"","property":"","from":"","to":"","reg":false,"x":1030,"y":1500,"wires":[["abc18e6f3296419e"]]},{"id":"bb6b8256ce7ce0bb","type":"ui_button","z":"d891a7b10eae2add","name":"","group":"a382a4b001eba5ca","order":5,"width":1,"height":1,"passthru":false,"label":"","tooltip":"","color":"","bgcolor":"","className":"","icon":"refresh","payload":"","payloadType":"str","topic":"payload","topicType":"msg","x":350,"y":1500,"wires":[["749e1a14e8928a0a"]]},{"id":"749e1a14e8928a0a","type":"change","z":"d891a7b10eae2add","name":"","rules":[{"t":"set","p":"payload","pt":"msg","to":"","tot":"str"}],"action":"","property":"","from":"","to":"","reg":false,"x":600,"y":1500,"wires":[["46ec7f82d017c103","e5b47db181b667ce"]]},{"id":"e5b47db181b667ce","type":"function","z":"d891a7b10eae2add","name":"startDateTimeReset","func":"var startDate = flow.get(\"startDate\") || false;\n\nstartDate = new Date(startDate);\n\nstartDate.setHours(0);\nstartDate.setMinutes(0);\n\nstartDate = startDate.getTime();\n\nmsg.payload = startDate;\nflow.set(\"startDate\",startDate);\nreturn msg;\n\n\n\n\n","outputs":1,"noerr":0,"initialize":"","finalize":"","libs":[],"x":860,"y":1560,"wires":[[]]},{"id":"a8fdd74bdb3e9ef4","type":"change","z":"d891a7b10eae2add","name":"","rules":[{"t":"set","p":"payload","pt":"msg","to":"","tot":"str"}],"action":"","property":"","from":"","to":"","reg":false,"x":580,"y":1640,"wires":[["5c78653dad4487cc","ab851eac39f22c94"]]},{"id":"ab851eac39f22c94","type":"function","z":"d891a7b10eae2add","name":"endDateTimeReset","func":"var endDate = flow.get(\"endDate\") || false;\n\nendDate = new Date(endDate);\n\nendDate.setHours(0);\nendDate.setMinutes(0);\n\nendDate = endDate.getTime();\n\nmsg.payload = endDate;\nflow.set(\"endDate\", endDate);\nreturn msg;\n\n\n\n\n","outputs":1,"noerr":0,"initialize":"","finalize":"","libs":[],"x":830,"y":1700,"wires":[[]]},{"id":"945c3a7a8d039e3f","type":"function","z":"d891a7b10eae2add","name":"parsing","func":"var jsonfile = msg.payload;\n\nconst resultArray = jsonfile.map(elm => ({ label: elm._id, payload: elm.payload/60/60 }));\n\n\nmsg.data = resultArray;\nreturn msg;\n","outputs":1,"noerr":0,"initialize":"","finalize":"","libs":[],"x":980,"y":2060,"wires":[["93f5de789b4414e5","1ac868e199e4bb9f"]]},{"id":"e0700b81ccd456ec","type":"ui_chart","z":"d891a7b10eae2add","name":"pie chart","group":"90cec7acd5df85b9","order":3,"width":0,"height":0,"label":"pie chart","chartType":"pie","legend":"true","xformat":"HH:mm:ss","interpolate":"linear","nodata":"","dot":false,"ymin":"","ymax":"","removeOlder":1,"removeOlderPoints":"","removeOlderUnit":"3600","cutout":"30","useOneColor":false,"useUTC":false,"colors":["#1f77b4","#aec7e8","#ff7f0e","#2ca02c","#98df8a","#d62728","#ff9896","#9467bd","#c5b0d5"],"outputs":1,"useDifferentColor":false,"className":"","x":1360,"y":2060,"wires":[["87b7266a9d05104f"]]},{"id":"49d943be617a9b1d","type":"ui_chart","z":"d891a7b10eae2add","name":"","group":"90cec7acd5df85b9","order":1,"width":0,"height":0,"label":"Sum Chart","chartType":"horizontalBar","legend":"false","xformat":"HH:mm:ss","interpolate":"linear","nodata":"","dot":false,"ymin":"","ymax":"","removeOlder":1,"removeOlderPoints":"","removeOlderUnit":"3600","cutout":"30","useOneColor":false,"useUTC":false,"colors":["#1f77b4","#aec7e8","#ff7f0e","#2ca02c","#98df8a","#d62728","#ff9896","#9467bd","#c5b0d5"],"outputs":1,"useDifferentColor":false,"className":"","x":1370,"y":2000,"wires":[["b978eebed7c9981b"]]},{"id":"3fb7cfa384092348","type":"function","z":"d891a7b10eae2add","name":"parsing","func":"var jsonfile = msg.payload;\n\nconst resultArray = jsonfile.map(elm => ({ label: elm._id, payload: elm.count / 60 / 60}));\n\n\nmsg.data = [resultArray];\nreturn msg;\n","outputs":1,"noerr":0,"initialize":"","finalize":"","libs":[],"x":1020,"y":2400,"wires":[["a3ad6ccd663a48c2"]]},{"id":"b175d885bcbe90a7","type":"function","z":"d891a7b10eae2add","name":"MongoDB Database Request For Bar Chart","func":"\n\n var startDate = flow.get(\"startDate\") || false;\n\n var endDate = flow.get(\"endDate\") || false;\n\n var selectedOption =msg.payload; \n \n if (startDate && endDate &&\n new Date(endDate) >= new Date(startDate)) {\n msg.payload = [[\n { $match: { \"timestamp\": { $gte: new Date(startDate), $lte: new Date(endDate) }, location: selectedOption } },\n {\n $group: {\n _id: { $dateToString: { format: \"%Y-%m-%d\", date: \"$timestamp\" } },\n count: { $sum: 1 }\n }\n },\n { $sort: { \"_id\": 1 } }\n ]];\n return msg;\n } else {\n node.warn(\"end date is before start date. or context not set\");\n }\n\n","outputs":1,"noerr":0,"initialize":"","finalize":"","libs":[],"x":650,"y":2480,"wires":[["02e1758ac564b4c3"]]},{"id":"02e1758ac564b4c3","type":"mongodb4","z":"d891a7b10eae2add","clientNode":"e4c17237ec481b9e","collection":"test2","operation":"aggregate","output":"toArray","name":"","x":860,"y":2420,"wires":[["3fb7cfa384092348"]]},{"id":"7cb9db4f5468f455","type":"function","z":"d891a7b10eae2add","name":"getAverage","func":"\nvar startDate = flow.get(\"startDate\") || false;\nvar endDate = flow.get(\"endDate\") || false;\nvar dateDiffer = new Date(endDate).getTime() - new Date(startDate).getTime();\n\n\ndateDiffer = dateDiffer / 1000 / 60 / 60 / 24;\n\n\nvar jsonfile = msg.payload;\n\nconst resultArray = jsonfile.map(elm => ({ label: elm._id, payload: (elm.payload / dateDiffer / 60 / 60).toFixed(2)}));\n\n\nmsg.data = resultArray;\n\nreturn msg;\n\n\n","outputs":1,"noerr":0,"initialize":"","finalize":"","libs":[],"x":1030,"y":2200,"wires":[["a60f90033cdcf690"]]},{"id":"bbf015aa7e658bdd","type":"ui_chart","z":"d891a7b10eae2add","name":"","group":"90cec7acd5df85b9","order":5,"width":0,"height":0,"label":"avg chart","chartType":"bar","legend":"false","xformat":"HH:mm:ss","interpolate":"linear","nodata":"","dot":false,"ymin":"","ymax":"","removeOlder":1,"removeOlderPoints":"","removeOlderUnit":"3600","cutout":0,"useOneColor":false,"useUTC":false,"colors":["#1f77b4","#aec7e8","#ff7f0e","#2ca02c","#98df8a","#d62728","#ff9896","#9467bd","#c5b0d5"],"outputs":1,"useDifferentColor":false,"className":"","x":1420,"y":2200,"wires":[["1e22feeee2d3bb89"]]},{"id":"e7b28b772ff8381c","type":"ui_dropdown","z":"d891a7b10eae2add","name":"","label":"Dynamic Options","tooltip":"","place":"장소","group":"8b7b05d8ef7ffa02","order":2,"width":4,"height":1,"passthru":true,"multiple":false,"options":[],"payload":"","topic":"options","topicType":"msg","className":"","x":410,"y":2560,"wires":[["b175d885bcbe90a7"]]},{"id":"f48d52994013a888","type":"function","z":"d891a7b10eae2add","name":"MongoDB Database Request For Bar Chart","func":"\n\n msg.payload = [\n [{ $group: { \"_id\": \"$location\" } }]\n ];\n return msg;\n","outputs":1,"noerr":0,"initialize":"","finalize":"","libs":[],"x":450,"y":2720,"wires":[["3cd69bc815be05a3"]]},{"id":"3cd69bc815be05a3","type":"mongodb4","z":"d891a7b10eae2add","clientNode":"e4c17237ec481b9e","collection":"test2","operation":"aggregate","output":"toArray","name":"","x":700,"y":2720,"wires":[["89349b7748190633"]]},{"id":"89349b7748190633","type":"function","z":"d891a7b10eae2add","name":"parsing","func":"var jsonfile = msg.payload;\nvar labelArray = new Array();\n\nvar label =\"\";\n\nvar resultArray = jsonfile.map(elm => ((elm._id)));\n\n\n\nmsg.options = resultArray;\nreturn msg;\n\n\n","outputs":1,"noerr":0,"initialize":"","finalize":"","libs":[],"x":840,"y":2720,"wires":[["e7b28b772ff8381c"]]},{"id":"018d542e97750b2b","type":"ui_chart","z":"d891a7b10eae2add","name":"","group":"8b7b05d8ef7ffa02","order":4,"width":0,"height":0,"label":"chart","chartType":"horizontalBar","legend":"false","xformat":"HH:mm:ss","interpolate":"linear","nodata":"","dot":false,"ymin":"","ymax":"","removeOlder":1,"removeOlderPoints":"","removeOlderUnit":"3600","cutout":0,"useOneColor":false,"useUTC":false,"colors":["#1f77b4","#aec7e8","#ff7f0e","#2ca02c","#98df8a","#d62728","#ff9896","#9467bd","#c5b0d5"],"outputs":1,"useDifferentColor":false,"className":"","x":1390,"y":2400,"wires":[["bb64d6c3bb9ba431"]]},{"id":"a3ad6ccd663a48c2","type":"function","z":"d891a7b10eae2add","name":"chartClear","func":"msg.payload = [];\nreturn msg;","outputs":1,"noerr":0,"initialize":"","finalize":"","libs":[],"x":1210,"y":2400,"wires":[["018d542e97750b2b"]]},{"id":"bb64d6c3bb9ba431","type":"function","z":"d891a7b10eae2add","name":"makeArray","func":"msg.payload=msg.data;\nreturn msg.payload;","outputs":1,"noerr":0,"initialize":"","finalize":"","libs":[],"x":1550,"y":2400,"wires":[["018d542e97750b2b"]]},{"id":"93f5de789b4414e5","type":"function","z":"d891a7b10eae2add","name":"chartClear","func":"msg.payload = [];\nreturn msg;","outputs":1,"noerr":0,"initialize":"","finalize":"","libs":[],"x":1190,"y":2000,"wires":[["49d943be617a9b1d"]]},{"id":"1ac868e199e4bb9f","type":"function","z":"d891a7b10eae2add","name":"chartClear","func":"msg.payload = [];\nreturn msg;","outputs":1,"noerr":0,"initialize":"","finalize":"","libs":[],"x":1190,"y":2060,"wires":[["e0700b81ccd456ec"]]},{"id":"b978eebed7c9981b","type":"function","z":"d891a7b10eae2add","name":"makeArray","func":"msg.payload=[msg.data];\nreturn msg.payload;","outputs":1,"noerr":0,"initialize":"","finalize":"","libs":[],"x":1550,"y":2000,"wires":[["49d943be617a9b1d"]]},{"id":"87b7266a9d05104f","type":"function","z":"d891a7b10eae2add","name":"makeArray","func":"msg.payload=[msg.data];\nreturn msg.payload;","outputs":1,"noerr":0,"initialize":"","finalize":"","libs":[],"x":1510,"y":2060,"wires":[["e0700b81ccd456ec"]]},{"id":"a60f90033cdcf690","type":"function","z":"d891a7b10eae2add","name":"chartClear","func":"msg.payload = [];\nreturn msg;","outputs":1,"noerr":0,"initialize":"","finalize":"","libs":[],"x":1210,"y":2200,"wires":[["bbf015aa7e658bdd"]]},{"id":"1e22feeee2d3bb89","type":"function","z":"d891a7b10eae2add","name":"makeArray","func":"msg.payload=[msg.data];\nreturn msg.payload;","outputs":1,"noerr":0,"initialize":"","finalize":"","libs":[],"x":1570,"y":2200,"wires":[["bbf015aa7e658bdd"]]},{"id":"5514fee18cd19562","type":"ui_button","z":"d891a7b10eae2add","name":"","group":"a382a4b001eba5ca","order":12,"width":4,"height":1,"passthru":false,"label":"그리기","tooltip":"","color":"","bgcolor":"","className":"","icon":"","payload":"query","payloadType":"str","topic":"payload","topicType":"msg","x":70,"y":2100,"wires":[["1134f9c88a72a8d9","f48d52994013a888"]]},{"id":"74605bce472d9345","type":"ui_dropdown","z":"d891a7b10eae2add","name":"","label":"","tooltip":"","place":"Select option","group":"09be15293d7f2213","order":1,"width":0,"height":0,"passthru":true,"multiple":false,"options":[{"label":"Set","value":"Set","type":"str"},{"label":"chart1","value":"chart1","type":"str"},{"label":"chart2","value":"chart2","type":"str"},{"label":"chart3","value":"chart3","type":"str"},{"label":"chart4","value":"chart4","type":"str"}],"payload":"","topic":"topic","topicType":"msg","className":"","x":360,"y":1140,"wires":[["2ad7649f490db821"]]},{"id":"2ad7649f490db821","type":"function","z":"d891a7b10eae2add","name":"showUI","func":"\n\nswitch(msg.payload){\n case \"Set\":\n msg.payload = { \"group\": { \"hide\": [\"Admin_admin2\", \"Admin_admin3\", \"Admin_admin4\", \"Admin_admin5\"], \"show\": [\"Admin_Control\", \"Admin_admin1\"] } };\n break;\n case \"chart1\":\n msg.payload = { \"group\": { \"hide\": [\"Admin_admin1\", \"Admin_admin3\", \"Admin_admin4\", \"Admin_admin5\"], \"show\": [\"Admin_Control\", \"Admin_admin2\"] } };\n break;\n case \"chart2\":\n msg.payload = { \"group\": { \"hide\": [\"Admin_admin1\", \"Admin_admin2\", \"Admin_admin4\", \"Admin_admin5\"], \"show\": [\"Admin_Control\", \"Admin_admin3\"] } };\n break;\n case \"chart3\":\n msg.payload = { \"group\": { \"hide\": [\"Admin_admin1\", \"Admin_admin2\", \"Admin_admin3\", \"Admin_admin5\"], \"show\": [\"Admin_Control\", \"Admin_admin4\"] } };\n break;\n case \"chart4\":\n msg.payload = { \"group\": { \"hide\": [\"Admin_admin1\" ,\"Admin_admin2\", \"Admin_admin3\", \"Admin_admin4\"], \"show\": [\"Admin_Control\", \"Admin_admin5\"] } };\n break;\n}\nreturn msg;","outputs":1,"noerr":0,"initialize":"","finalize":"","libs":[],"x":500,"y":1140,"wires":[["f4861000a83bf631"]]},{"id":"a1d9e9d71ae3865a","type":"inject","z":"d891a7b10eae2add","name":"","props":[{"p":"payload"}],"repeat":"","crontab":"","once":true,"onceDelay":0.1,"topic":"","payload":"Set","payloadType":"str","x":150,"y":1180,"wires":[["74605bce472d9345"]]},{"id":"5aab8bb65e8aaf4a","type":"function","z":"d891a7b10eae2add","name":"MongoDB Database Request","func":"var res = new Date(msg.payload);\n//Check Your Local Time!! This flow is based on the current time in KST.(UTC+9)\nvar startDate = new Date(res.getFullYear(), res.getMonth(), res.getDate(), 0+9, 0, 0, 0);\nvar endDate = new Date(res.getFullYear(), res.getMonth(), res.getDate(), 23+9, 59, 59, 0);\n\n// check if date range is correct\nif (startDate && endDate &&\n new Date(endDate) >= new Date(startDate)) {\n msg.payload = [[\n { $match: { \"timestamp\": { $gte: new Date(startDate), $lte: new Date(endDate) } } },\n { $sort: { \"timestamp\": 1 } }\n ]];\n return msg;\n} else {\n node.warn(\"end date is before start date. or context not set\");\n}\n\n\n\n","outputs":1,"noerr":0,"initialize":"","finalize":"","libs":[],"x":580,"y":2860,"wires":[["e76f1558b014b2a3"]]},{"id":"e76f1558b014b2a3","type":"mongodb4","z":"d891a7b10eae2add","clientNode":"e4c17237ec481b9e","collection":"test2","operation":"aggregate","output":"toArray","name":"","x":800,"y":2860,"wires":[["88e0ab3c5c3137d0"]]},{"id":"88e0ab3c5c3137d0","type":"function","z":"d891a7b10eae2add","name":"DataParsing","func":"let labels = [];\nlet labels_dic = {};\n\n\nfor (let data of msg.payload) {\n if (data.location in labels_dic) {\n let idx = labels_dic[data.location].index;\n var diffTime = (data.timestamp.getTime() - labels_dic[data.location].datas[idx][2].getTime()) / (1000 * 60);\n if (diffTime < 0) diffTime *= -1;\n if (diffTime > 10) {\n labels_dic[data.location].index = idx + 1;\n let list = [data.location, data.timestamp, data.timestamp];\n labels_dic[data.location].datas.push(list);\n }\n else {\n labels_dic[data.location].datas[idx][2] = data.timestamp;\n }\n\n }\n else {\n labels_dic[data.location] = { \"index\": 0, datas: [] };\n let list = [data.location, data.timestamp, data.timestamp];\n labels_dic[data.location].datas.push(list);\n }\n\n}\n\nfor (let key in labels_dic) {\n for (let data of labels_dic[key].datas) {\n labels.push(data);\n }\n}\n\nmsg.payload = labels;\n\nreturn msg;","outputs":1,"noerr":0,"initialize":"","finalize":"","libs":[],"x":970,"y":2860,"wires":[["9d96ae9733473457"]]},{"id":"9d96ae9733473457","type":"function","z":"d891a7b10eae2add","name":"Track Events","func":"let colorArray = ['#FF6633', '#5DA5DA', '#FAA43A', '#60BD68', '#F17CB0', '#B2912F', '#B276B2', '#DECF3F', '#F15854','#4D4D4D'];\nlet cache = {\n labels: [],\n datasets: [],\n\n}\n\nfor (let lab of msg.payload) {\n if (cache.labels.indexOf(lab[0]) == -1) {\n cache.labels.push(lab[0]);\n\n cache.datasets.push({\n label: lab[0],\n timestamp: new Date(),\n data: []\n });\n }\n\n var thisIndex = cache.labels.indexOf(lab[0]);\n let start_date = new Date(lab[1].getFullYear(), lab[1].getMonth(), lab[1].getDate(), lab[1].getHours()-9, lab[1].getMinutes(), 0, 0);\n let end_date = new Date(lab[2].getFullYear(), lab[2].getMonth(), lab[2].getDate(), lab[2].getHours()-9, lab[2].getMinutes(), 0, 0);\n cache.datasets[thisIndex].data.push([start_date, end_date, colorArray[thisIndex]]);\n}\n\nmsg.cache = cache;\n\nreturn msg;","outputs":1,"noerr":0,"initialize":"","finalize":"","libs":[],"x":1150,"y":2860,"wires":[["93aa160449c67d96"]]},{"id":"e0932e5b439a1acd","type":"ui_template","z":"d891a7b10eae2add","group":"121de9498c2590ff","name":"ChartJS Timeline Library","order":1,"width":0,"height":0,"format":"<script>\n const helpers2 = Chart.helpers;\n const isArray2 = helpers2.isArray;\n \n var time = {\n units: [{\n name: 'millisecond',\n steps: [1, 2, 5, 10, 20, 50, 100, 250, 500]\n }, {\n name: 'second',\n steps: [1, 2, 5, 10, 30]\n }, {\n name: 'minute',\n steps: [1, 2, 5, 10, 30]\n }, {\n name: 'hour',\n steps: [1, 2, 3, 6, 12]\n }, {\n name: 'day',\n steps: [1, 2, 3, 5]\n }, {\n name: 'week',\n maxStep: 4\n }, {\n name: 'month',\n maxStep: 3\n }, {\n name: 'quarter',\n maxStep: 4\n }, {\n name: 'year',\n maxStep: false\n }]\n };\n \n var myConfig2 = {\n myTime : {\n redoLabels: false\n },\n position: 'bottom',\n \n time: {\n parser: false, // false == a pattern string from http://momentjs.com/docs/#/parsing/string-format/ or a custom callback that converts its argument to a moment\n format: false, // DEPRECATED false == date objects, moment object, callback or a pattern string from http://momentjs.com/docs/#/parsing/string-format/\n unit: false, // false == automatic or override with week, month, year, etc.\n round: false, // none, or override with week, month, year, etc.\n displayFormat: false, // DEPRECATED\n isoWeekday: false, // override week start day - see http://momentjs.com/docs/#/get-set/iso-weekday/\n minUnit: 'minute',\n \n // defaults to unit's corresponding unitFormat below or override using pattern string from http://momentjs.com/docs/#/displaying/format/\n displayFormats: {\n millisecond: 'h:mm:ss.SSS a', // 11:20:01.123 AM,\n second: 'h:mm:ss a', // 11:20:01 AM\n minute: 'a h:mm:ss', // 11:20:01 AM\n quarter: '[Q]Q - YYYY', // Q3\n year: 'YYYY', // 2015 \n hour: 'MMM D, hA', // Sept 4, 5PM\n day: 'll', // Sep 4 2015\n week: 'll', // Week 46, or maybe \"[W]WW - YYYY\" ?\n month: 'MMM YYYY', // Sept 2015\n }\n },\n ticks: {\n autoSkip: false\n }\n };\n \n \n var myTimeScale2 = Chart.scaleService.getScaleConstructor('time').extend({\n \n determineDataLimits: function() {\n var me = this;\n me.labelMoments = [];\n \n // We parse all date labels here, for each entry we parse its initial and end date\n var scaleLabelMoments = [];\n \n if (me.chart.data.datasets && me.chart.data.datasets.length > 0) {\n \n helpers2.each(me.chart.data.datasets, function(datasets) {\n var data = datasets.data;\n var length = data.length;\n //var startLabelMoment = \n var startDate = new Date(data[0][0]);\n var endDate = new Date(data[0][0]);\n startDate.setHours(0,0,0,0);\n endDate.setHours(0,0,0,0);\n endDate.setDate(endDate.getDate() + 1);\n var startMoment = me.parseTime(startDate.toISOString());\n var endMoment = me.parseTime(endDate.toISOString());\n scaleLabelMoments.unshift(startMoment);\n scaleLabelMoments.push(endMoment);\n\n //여기부터 원본\n for (var i = 0; i < length; i++) {\n // We consider 0 to have initial date\n var initialLabelMoment = me.parseTime(data[i][0]);\n // we consider 1 to have end date\n // TODO maybe add a check to see which one is bigger, but right now i don't know the\n // TODO implications off that check\n var finalLabelMoment = me.parseTime(data[i][1]);\n if (initialLabelMoment.isValid()) {\n if (me.options.time.round) {\n initialLabelMoment.startOf(me.options.time.round);\n }\n scaleLabelMoments.push(initialLabelMoment);\n }\n if (finalLabelMoment.isValid()) {\n if (me.options.time.round) {\n finalLabelMoment.startOf(me.options.time.round);\n }\n scaleLabelMoments.push(finalLabelMoment);\n }\n }\n }, me);\n \n me.firstTick = moment.min.call(me, scaleLabelMoments);\n me.lastTick = moment.max.call(me, scaleLabelMoments);\n } else {\n me.firstTick = null;\n me.lastTick = null;\n }\n \n // In this case label moments are the same as scale moments because this chart only supports\n // dates as data and not labels like normal time scale. We are doing this to keep\n // coordination between parent(TimeScale) calls\n me.labelMoments.push(scaleLabelMoments);\n\n // Set these after we've done all the data\n if (me.options.time.min) {\n me.firstTick = me.parseTime(me.options.time.min);\n }\n \n if (me.options.time.max) {\n me.lastTick = me.parseTime(me.options.time.max);\n }\n \n // We will modify these, so clone for later\n me.firstTick = (me.firstTick || moment()).clone();\n me.lastTick = (me.lastTick || moment()).clone();\n },\n buildLabelDiffs: function() {\n var me = this;\n me.labelDiffs = [];\n var scaleLabelDiffs = [];\n // Parse common labels once\n if (me.chart.data.datasets && me.chart.data.datasets.length > 0) {\n helpers2.each(me.chart.data.datasets, function(datasets, datasetIndex) {\n var data = datasets.data;\n var length = data.length;\n for (var i = 0; i < length; i++) {\n // We consider 0 to have initial date\n var initialLabelMoment = me.parseTime(data[i][0]);\n // we consider 1 to have end date\n // TODO maybe add a check to see which one is bigger, but right now i don't know the\n // TODO implications off that check\n var finalLabelMoment = me.parseTime(data[i][1]);\n var diff;\n if (initialLabelMoment.isValid()) {\n if (me.options.time.round) {\n diff = initialLabelMoment.diff(me.firstTick, me.tickUnit, false);\n }\n else {\n if (me.isInTicks(initialLabelMoment, me.tickUnit))\n // No floor needed since we are one of the ticks\n diff = initialLabelMoment.diff(me.firstTick, me.tickUnit, false);\n else\n diff = initialLabelMoment.diff(me.firstTick, me.tickUnit, true);\n }\n scaleLabelDiffs.push(diff);\n }\n if (finalLabelMoment.isValid()) {\n if (me.options.time.round) {\n // Moment doesn't round on diff anymore\n diff = finalLabelMoment.diff(me.firstTick, me.tickUnit, false);\n }\n else\n {\n if (me.isInTicks(finalLabelMoment, me.tickUnit))\n // No floor needed since we are one of the ticks\n diff = finalLabelMoment.diff(me.firstTick, me.tickUnit, false);\n else\n diff = finalLabelMoment.diff(me.firstTick, me.tickUnit, true);\n }\n scaleLabelDiffs.push(diff);\n }\n }\n me.labelDiffs[datasetIndex] = scaleLabelDiffs;\n scaleLabelDiffs = [];\n }, me);\n }\n \n \n },\n \n // This function is different from parent because the second argument of the index inside the array of dates\n // e.g [initialDate, endDate]. Since we built the diffs in date order, which means that every 2 entries in\n // me.labelDiffs represent one set of date with initial and end dates by order.\n getLabelDiff: function (datasetIndex, dateIndex) {\n var me = this;\n if (datasetIndex === null || dateIndex === null)\n return null;\n \n if (me.labelDiffs === undefined)\n me.buildLabelDiffs();\n \n if (me.labelDiffs[datasetIndex] != undefined)\n return me.labelDiffs[datasetIndex][dateIndex];\n \n return null;\n },\n \n getPixelForValue: function(value, index, datasetIndex) {\n var me = this;\n var offset = null;\n if (index !== undefined && datasetIndex !== undefined) {\n offset = me.getLabelDiff(datasetIndex, index);\n }\n \n if (offset === null) {\n if (!value || !value.isValid) {\n // not already a moment object\n value = me.parseTime(me.getRightValue(value));\n }\n if (value && value.isValid && value.isValid()) {\n offset = value.diff(me.firstTick, me.tickUnit, false);\n }\n }\n \n if (offset !== null) {\n var decimal = offset !== 0 ? offset / me.scaleSizeInUnits : offset;\n \n if (me.isHorizontal()) {\n var valueOffset = (me.width * decimal);\n return me.left + Math.round(valueOffset);\n }\n \n var heightOffset = (me.height * decimal);\n return me.top + Math.round(heightOffset);\n }\n },\n \n // Checks if some date object is a tickMoment\n isInTicks: function (date, unit) {\n var result = false;\n var length = this.tickMoments.length;\n var ticks = this.tickMoments;\n for(var i = 0; i < length; i++)\n {\n var tick = ticks[i];\n if (date.isSame(tick, unit))\n {\n result = true;\n break;\n }\n }\n return result;\n }\n });\n \n \n Chart.scaleService.registerScaleType('myTime2', myTimeScale2, myConfig2);\n \n \n \n Chart.controllers.timeLine2 = Chart.controllers.bar.extend({\n \n getBarBounds : function (bar) {\n var vm = bar._view;\n var x1, x2, y1, y2;\n \n x1 = vm.x;\n x2 = vm.x + vm.width;\n y1 = vm.y;\n y2 = vm.y + vm.height;\n \n return {\n left : x1,\n top: y1,\n right: x2,\n bottom: y2\n };\n \n },\n \n update: function(reset) {\n var me = this;\n var meta = me.getMeta();\n helpers2.each(meta.data, function(rectangle, index) {\n me.updateElement(rectangle, index, reset);\n }, me);\n },\n \n updateElement: function(rectangle, index, reset) {\n var me = this;\n var meta = me.getMeta();\n var xScale = me.getScaleForId(meta.xAxisID);\n var yScale = me.getScaleForId(meta.yAxisID);\n var dataset = me.getDataset();\n var data = dataset.data[index];\n var custom = rectangle.custom || {};\n var datasetIndex = me.index;\n var rectangleElementOptions = me.chart.options.elements.rectangle;\n \n rectangle._xScale = xScale;\n rectangle._yScale = yScale;\n rectangle._datasetIndex = me.index;\n rectangle._index = index;\n \n var ruler = me.getRuler(index);\n \n if (index !== 0)\n index = index * 2;\n \n var x = xScale.getPixelForValue(data, index , datasetIndex);\n index++;\n var end = xScale.getPixelForValue(data, index, datasetIndex);\n \n var y = yScale.getPixelForValue(data, datasetIndex, datasetIndex);\n var width = end - x;\n var height = me.calculateBarHeight(ruler);\n var color = me.chart.options.colorFunction(data);\n \n // This one has in account the size of the tick and the height of the bar, so we just\n // divide both of them by two and subtract the height part and add the tick part\n // to the real position of the element y. The purpose here is to place the bar\n // in the middle of the tick.\n var boxY = y + (ruler.tickHeight / 2) - (height / 2);\n \n\n rectangle._model = {\n x: reset ? x - width : x, // Top left of rectangle\n y: boxY , // Top left of rectangle\n width: width,\n height: height,\n base: x + width,\n backgroundColor: color,\n borderSkipped: custom.borderSkipped ? custom.borderSkipped : rectangleElementOptions.borderSkipped,\n borderColor: custom.borderColor ? custom.borderColor : helpers2.getValueAtIndexOrDefault(dataset.borderColor, index, rectangleElementOptions.borderColor),\n borderWidth: custom.borderWidth ? custom.borderWidth : helpers2.getValueAtIndexOrDefault(dataset.borderWidth, index, rectangleElementOptions.borderWidth),\n // Tooltip\n label: me.chart.data.labels[index],\n datasetLabel: dataset.label\n };\n \n \n \n rectangle.draw = function() {\n var ctx = this._chart.ctx;\n var vm = this._view;\n ctx.beginPath();\n ctx.fillStyle = vm.backgroundColor;\n ctx.lineWidth = vm.borderWidth;\n helpers2.drawRoundedRectangle(ctx, vm.x, vm.y, vm.width, vm.height, 1);\n ctx.fill();\n };\n \n rectangle.inXRange = function (mouseX) {\n var bounds = me.getBarBounds(this);\n return mouseX >= bounds.left && mouseX <= bounds.right;\n };\n rectangle.tooltipPosition = function () {\n var vm = this.getCenterPoint();\n return {\n x: vm.x ,\n y: vm.y\n };\n };\n \n rectangle.getCenterPoint = function () {\n var vm = this._view;\n var x, y;\n x = vm.x + (vm.width / 2);\n y = vm.y + (vm.height / 2);\n \n return {\n x : x,\n y : y\n };\n };\n \n rectangle.inRange = function (mouseX, mouseY) {\n var inRange = false;\n \n if(this._view)\n {\n var bounds = me.getBarBounds(this);\n inRange = mouseX >= bounds.left && mouseX <= bounds.right &&\n mouseY >= bounds.top && mouseY <= bounds.bottom;\n }\n return inRange;\n };\n \n rectangle.pivot();\n },\n \n // From controller.bar\n getRuler: function(index) {\n var me = this;\n var meta = me.getMeta();\n var yScale = me.getScaleForId(meta.yAxisID);\n var datasetCount = me.getBarCount();\n \n var tickHeight;\n if (yScale.options.type === 'category') {\n tickHeight = yScale.getPixelForTick(index + 1) - yScale.getPixelForTick(index);\n } else {\n // Average width\n tickHeight = yScale.width / yScale.ticks.length;\n }\n var categoryHeight = tickHeight * yScale.options.categoryPercentage;\n var categorySpacing = (tickHeight - (tickHeight * yScale.options.categoryPercentage)) / 2;\n var fullBarHeight = categoryHeight / datasetCount;\n \n if (yScale.ticks.length !== me.chart.data.labels.length) {\n var perc = yScale.ticks.length / me.chart.data.labels.length;\n fullBarHeight = fullBarHeight * perc;\n }\n \n var barHeight = fullBarHeight * yScale.options.barPercentage;\n var barSpacing = fullBarHeight - (fullBarHeight * yScale.options.barPercentage);\n \n return {\n datasetCount: datasetCount,\n tickHeight: tickHeight,\n categoryHeight: categoryHeight,\n categorySpacing: categorySpacing,\n fullBarHeight: fullBarHeight,\n barHeight: barHeight,\n barSpacing: barSpacing\n };\n },\n \n // From controller.bar\n getBarCount: function() {\n var me = this;\n var barCount = 0;\n helpers2.each(me.chart.data.datasets, function(dataset, datasetIndex) {\n var meta = me.chart.getDatasetMeta(datasetIndex);\n if (meta.bar && me.chart.isDatasetVisible(datasetIndex)) {\n ++barCount;\n }\n }, me);\n return barCount;\n },\n \n \n // draw\n draw: function (ease) {\n var easingDecimal = ease || 1;\n var i, len;\n var metaData = this.getMeta().data;\n for (i = 0, len = metaData.length; i < len; i++)\n {\n metaData[i].transition(easingDecimal).draw();\n }\n },\n \n // From controller.bar\n calculateBarHeight: function(ruler) {\n var me = this;\n var yScale = me.getScaleForId(me.getMeta().yAxisID);\n if (yScale.options.barThickness) {\n return yScale.options.barThickness;\n }\n return yScale.options.stacked ? ruler.categoryHeight : ruler.barHeight;\n },\n \n removeHoverStyle: function(e) {\n // TODO\n },\n \n setHoverStyle: function(e) {\n // TODO: Implement this\n }\n \n });\n \n \n Chart.defaults.timeLine2 = {\n \n colorFunction: function() {\n return 'black';\n },\n \n layout: {\n padding: {\n left: 5,\n right: 5,\n top: 0\n }\n },\n \n\n \n scales: {\n xAxes: [{\n type: 'myTime2',\n position: 'bottom',\n gridLines: {\n display: true,\n offsetGridLines: true,\n drawBorder: true,\n drawTicks: true\n },\n ticks: {\n maxRotation: 0,\n fontColor : \"white\",\n //fontWeight: bold\n },\n unit: 'day'\n }],\n yAxes: [{\n type: 'category',\n position: 'left',\n barThickness : 30,\n gridLines: {\n display: true,\n offsetGridLines: true,\n drawBorder: true,\n drawTicks: true\n },\n ticks: {\n fontColor : \"white\",\n //fontWeight: bold\n },\n }]\n },\n tooltips: {\n mode: 'single',\n callbacks: {\n title: function(tooltipItems, data) {\n return data.labels[tooltipItems[0].datasetIndex];\n },\n label: function(tooltipItem, data) {\n start_date = new Date(data.datasets[tooltipItem.datasetIndex].data[tooltipItem.index][0]);\n //start_date.setMonth(start_date.getMonth() - 1);\n end_date = new Date(data.datasets[tooltipItem.datasetIndex].data[tooltipItem.index][1]);\n //end_date.setMonth(end_date.getMonth() - 1);\n return [\"Start: \" + start_date.toLocaleString(),\n \"End: \" + end_date.toLocaleString()\n ]\n }\n }\n }\n };\n \n</script>","storeOutMessages":true,"fwdInMessages":true,"resendOnRefresh":false,"templateScope":"global","className":"","x":1350,"y":2800,"wires":[[]]},{"id":"93aa160449c67d96","type":"ui_template","z":"d891a7b10eae2add","group":"121de9498c2590ff","name":"ChartJS Timeline","order":4,"width":30,"height":7,"format":"<style type=\"text/css\">\n .chartAreaWrapper {\n overflow-x: scroll;\n }\n</style>\n\n\n<script>\n var ctx = document.getElementById(\"chartjs_timeline_1\").getContext(\"2d\");\n var ctx9Axis = document.getElementById(\"chart9Axis\").getContext(\"2d\");\n\n scope.chart = new Chart(ctx, {\n type: \"timeLine2\",\n options: {\n animation: false,\n responsive: false,\n colorFunction: function(data){\n // data is the dataset event point.\n // The first and second entries are the start/stop date\n //The third entry specifies the color to use\n return (typeof data[2] === 'undefined' ? 'black' : data[2]);\n }\n },\n animation: {\n onComplete: function(animation){\n var sourceCanvas = ctx.canvas;\n var copyWidth = this.chart.width;\n var copyHeight = this.chart.height;\n var targetElementWidth = ctx9.canvas.clientWidth;\n var targetElementHeight = ctx9.canvas.clientHeight;\n \n ctx9Axis.canvas.width = copyWidth;\n ctx9Axis.canvas.height = copyHeight;\n \n ctx9Axis.drawImage(sourceCanvas, 0, 0, targetElementWidth, targetElementHeight);\n }\n },\n data: {\n labels: [],\n datasets: []\n }\n });\n \n \n (function(scope){\n scope.$watch('msg', function(msg) {\n if(typeof(msg) !== \"object\") return;\n \n if(typeof(msg.cache) === \"object\"){\n scope.chart.config.data.labels = msg.cache.labels;\n scope.chart.config.data.datasets = msg.cache.datasets;\n }\n \n //redraw\n scope.chart.update();\n });\n })(scope);\n \n</script>\n\n\n<div class=\"chart_wrapper\" style=\"width: 90%\">\n <div class=\"chartAreaWrapper\">\n <canvas class=\"chart1\" id=\"chartjs_timeline_1\" width=\"4500px\" height=\"250px\"></canvas>\n <canvas id=\"chart9Axis\" height=\"100\" width=\"32\">\n </div>\n\n</div>","storeOutMessages":true,"fwdInMessages":true,"resendOnRefresh":false,"templateScope":"local","className":"","x":1350,"y":2860,"wires":[[]]},{"id":"f7e7e5dfc523fe58","type":"ui_date_picker","z":"d891a7b10eae2add","name":"","label":"date","group":"121de9498c2590ff","order":2,"width":6,"height":1,"passthru":true,"topic":"topic","topicType":"msg","className":"","x":350,"y":2860,"wires":[["5aab8bb65e8aaf4a"]]},{"id":"82e9bfa5e6feb7ac","type":"inject","z":"d891a7b10eae2add","name":"","props":[{"p":"payload"},{"p":"topic","vt":"str"}],"repeat":"","crontab":"","once":true,"onceDelay":0.1,"topic":"","payload":"","payloadType":"date","x":210,"y":2860,"wires":[["f7e7e5dfc523fe58"]]},{"id":"9337caff862073ac","type":"inject","z":"d891a7b10eae2add","name":"","props":[{"p":"payload"},{"p":"topic","vt":"str"}],"repeat":"","crontab":"","once":true,"onceDelay":0.1,"topic":"","payload":"","payloadType":"date","x":330,"y":2960,"wires":[["5aab8bb65e8aaf4a"]]},{"id":"de6a7c9146ee1a18","type":"comment","z":"d891a7b10eae2add","name":"Check Your Local Time!! This flow is based on the current time in KST.(UTC+9)","info":"","x":770,"y":2820,"wires":[]},{"id":"a382a4b001eba5ca","type":"ui_group","name":"admin1","tab":"dd3e6b932a1001f1","order":2,"disp":true,"width":"6","collapse":false,"className":""},{"id":"e4c17237ec481b9e","type":"mongodb4-client","name":"AWS mongoDB","protocol":"mongodb","hostname":"J7S005.p.ssafy.io","port":"","dbName":"flow_db","authSource":"","authMechanism":"DEFAULT","tls":false,"tlsCAFile":"","tlsInsecure":false,"uri":"","advanced":"","uriTabActive":"tab-uri-simple"},{"id":"90cec7acd5df85b9","type":"ui_group","name":"admin2","tab":"dd3e6b932a1001f1","order":3,"disp":true,"width":"6","collapse":false,"className":""},{"id":"8b7b05d8ef7ffa02","type":"ui_group","name":"admin3","tab":"dd3e6b932a1001f1","order":4,"disp":true,"width":"6","collapse":false,"className":""},{"id":"09be15293d7f2213","type":"ui_group","name":"Control","tab":"dd3e6b932a1001f1","order":1,"disp":true,"width":"6","collapse":false,"className":""},{"id":"121de9498c2590ff","type":"ui_group","name":"admin4","tab":"dd3e6b932a1001f1","order":5,"disp":true,"width":30,"collapse":false,"className":""},{"id":"dd3e6b932a1001f1","type":"ui_tab","name":"Admin","icon":"dashboard","disabled":false,"hidden":false}]